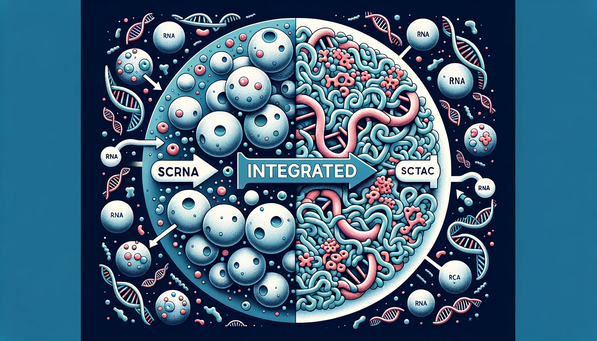
Integrating scRNA-Seq and scATAC-Seq Data: A Primer© DALLE3

Integrating scRNA-Seq and scATAC-Seq Data: A Primer

Single-cell sequencing technologies have revolutionized our understanding of cellular heterogeneity. Among these technologies, scRNA-Seq and scATAC-Seq stand out for their ability to profile gene expression and chromatin accessibility, respectively. But how can we integrate these two types of data to gain a more comprehensive view of cellular states? Let’s dive in!

Other tutorial: Seurat tutorial

Understanding the Data

  • scRNA-Seq: Provides gene expression levels in individual cells. The resulting matrix has genes as rows and cells as columns, with values representing gene expression levels.

  • scATAC-Seq: Profiles chromatin accessibility at specific genomic regions. The resulting matrix has genomic regions (peaks) as rows and cells as columns, with binary values indicating accessibility.

The Challenge

At first glance, these matrices seem incompatible. One provides gene-centric information, while the other is focused on genomic regions. So, how can we integrate them?

From Peaks to Genes

A common approach is to associate scATAC-Seq peaks with nearby genes. This can transform the scATAC-Seq matrix into a gene-by-cell matrix, similar to scRNA-Seq. Strategies include:

  • Assigning each peak to the nearest gene’s transcription start site (TSS).
  • Using tools that provide more sophisticated peak-to-gene assignment methods.

Integration Using Latent Spaces

Tools like Seurat don’t directly merge the matrices. Instead, they:

  1. Identify shared “latent spaces” or underlying patterns in the data.
  2. Find features (genes) that are highly variable in both datasets to serve as “anchors.”
  3. Use these anchors to align the datasets in a shared latent space.

Once integrated, joint analyses, such as clustering, can identify cell types present in both datasets.

Example Integration Workflow

From Peak to Seurat Object

A Seurat Object for ATAC data need more things than RNA matrix.

  • Except peak matrix as the ChromatinAssay object,
  • we still need to ready the Chromosome annatation file for gene activity estimation.
  • We also need the Fragment Object.
library(Signac)
library(Seurat)

# read the peak counts matrix
peaks <- readRDS('norm_peak_counts.rds')
# convert it as ChromatinAssay object. We can define the type of genome here. But I chooce not.
chromatinassay <- CreateChromatinAssay(counts = peaks)#, genome = "dm6")
atac_seurat <- CreateSeuratObject(counts = chromatinassay, assay = "ATAC")

# read meta infors for the cells if you have
cell_predictions <- readRDS("cell_predictions.rds")
atac_seurat@meta.data <- cbind(atac_seurat@meta.data, cell_info_all)

# if you have pre-ran demention redundance data like UMAP
atac_seurat[["UMAP"]] <- CreateDimReducObject(embeddings = as.matrix(cell_info_all[c("UMAP_1", "UMAP_2")]), key = "UMAP_", assay = DefaultAssay(atac_seurat))

atac_seurat <- NormalizeData(atac_seurat)
atac_seurat <- FindVariableFeatures(atac_seurat)

# add Fragments object for gene activity counting
fragments <- CreateFragmentObject('fragments.tsv.gz', cells = colnames(x = atac_seurat), verbose = FALSE, tolerance = 0.5)
Fragments(atac_seurat) <- fragments

# Annotation information
# cite: https://github.com/stuart-lab/signac/discussions/1088
library(AnnotationHub)
ah <- AnnotationHub()
query(ah, "EnsDb")
ahDb <- query(ah, pattern = c("Drosophila", "EnsDb"))
flygenome <- ahDb[[19]]
annotations <- GetGRangesFromEnsDb(ensdb = flygenome)
seqlevelsStyle(annotations) <- 'NCBI'
Annotation(atac_seurat) <- annotations

# save the ATAC Seurat object to avoid the creating again
saveRDS(atac_seurat, 'scATAC.rds')

Integration

# Normalize and find variable features for both datasets
atac_seurat <- NormalizeData(atac_seurat)
atac_seurat <- FindVariableFeatures(atac_seurat)

rna_seurat <- NormalizeData(rna_seurat)
rna_seurat <- FindVariableFeatures(rna_seurat)

# run the lsi demaintion dungration
pbmc.atac <- RunTFIDF(pbmc.atac)
pbmc.atac <- FindTopFeatures(pbmc.atac, min.cutoff = "q0")
pbmc.atac <- RunSVD(pbmc.atac)


# estimate the gene activities of the feature genes
gene.activities <- GeneActivity(pbmc.atac, features = VariableFeatures(pbmc.rna))

pbmc.atac[["ACTIVITY"]] <- CreateAssayObject(counts = gene.activities)
DefaultAssay(pbmc.atac) <- "ACTIVITY"
pbmc.atac <- NormalizeData(pbmc.atac)
pbmc.atac <- ScaleData(pbmc.atac, features = rownames(pbmc.atac))

Anchors identifycation

This step would take lots of time.

# Identify anchors
transfer.anchors <- FindTransferAnchors(reference = rna_seurat, query = atac_seurat, features = VariableFeatures(object = rna_seurat),
reference.assay = "RNA", query.assay = "ACTIVITY", reduction = "cca")

Label transfer

After identifying anchors, we can transfer annotations from the scRNA-seq dataset onto the scATAC-seq cells. The annotations are stored in the seurat_annotations field, and are provided as input to the refdata parameter. The output will contain a matrix with predictions and confidence scores for each ATAC-seq cell.

celltype.predictions <- TransferData(anchorset = transfer.anchors, refdata = rna_seurat$seurat_annotations,
weight.reduction = atac_seurat[["lsi"]], dims = 2:30)

atac_seurat <- AddMetaData(atac_seurat, metadata = celltype.predictions)

Co-embedding scRNA-seq and scATAC-seq datasets

# note that we restrict the imputation to variable genes from scRNA-seq, but could impute the
# full transcriptome if we wanted to
genes.use <- VariableFeatures(rna_seurat)

# if your rna_seurat is integrated result, I believe you'ld prefer use `assay = "integrated"`
refdata <- GetAssayData(rna_seurat, assay = "RNA", slot = "data")[genes.use, ]

# refdata (input) contains a scRNA-seq expression matrix for the scRNA-seq cells. imputation
# (output) will contain an imputed scRNA-seq matrix for each of the ATAC cells
imputation <- TransferData(anchorset = transfer.anchors, refdata = refdata, weight.reduction = atac_seurat[["lsi"]],
dims = 2:30)
atac_seurat[["RNA"]] <- imputation

coembed <- merge(x = rna_seurat, y = atac_seurat)

# Finally, we run PCA and UMAP on this combined object, to visualize the co-embedding of both
# datasets
coembed <- ScaleData(coembed, features = genes.use, do.scale = FALSE)
coembed <- RunPCA(coembed, features = genes.use, verbose = FALSE)
coembed <- RunUMAP(coembed, dims = 1:30)

DimPlot(coembed, group.by = c("orig.ident", "seurat_annotations"))
Seruat: ATAC-RNA data integration
© Seurat

Conclusion

Integrating scRNA-Seq and scATAC-Seq data provides a holistic view of cellular states, combining gene expression and chromatin accessibility information. While the integration process might seem daunting, understanding the underlying principles and using the right tools can make it achievable and insightful.

Integrating scRNA-Seq and scATAC-Seq Data: A Primer
https://karobben.github.io/2023/10/16/Bioinfor/scATAC/

Author

Karobben

Posted on

2023-10-16

Updated on

2024-01-11

Licensed under

Comments