scRNA-Seq: makers explore
Seurat is a popular R package for single-cell RNA sequencing (scRNA-seq) data analysis. If you’ve already processed your data and assigned cell identities (classes), then finding differentially expressed genes (DEGs) between two different classes is a common next step.
Here’s a brief step-by-step guide on how to identify DEGs between two cell types or classes using Seurat:
-
Setup:
First, make sure you have the Seurat library loaded.library(Seurat) -
Differential Expression:
Use theFindMarkersfunction in Seurat to identify DEGs. You can specify the two groups you are interested in by setting theident.1andident.2parameters.For example, if you have two classes named “ClassA” and “ClassB”, you can identify DEGs between these two classes as follows:
de_genes <- FindMarkers(object = your_seurat_object,
             ident.1 = "ClassA",
             ident.2 = "ClassB",
             min.pct = 0.25,
             logfc.threshold = 0.25,
             group.by = "Final_id")
|++++++++++++++++++++++++++++++++++++++++++++++++++| 100% elapsed=29s
your_seurat_objectis your Seurat object.min.pctis the minimum percentage of cells where the gene must be detected in either of the two groups.logfc.thresholdis the minimum log-fold change threshold.group.byis the colname frommetadata
-
Inspect Results:
The resultingde_genesdata frame will contain differentially expressed genes between “ClassA” and “ClassB”. It will include columns for the average expression in each class, the percentage of cells expressing the gene in each class, the log fold-change, and the adjusted p-value (among other metrics). -
Filter Based on Significance:
You might want to filter out genes based on a significance threshold, for instance, an adjusted p-value less than 0.05:significant_genes <- de_genes[de_genes$p_val_adj < 0.05, ] -
Visualize:
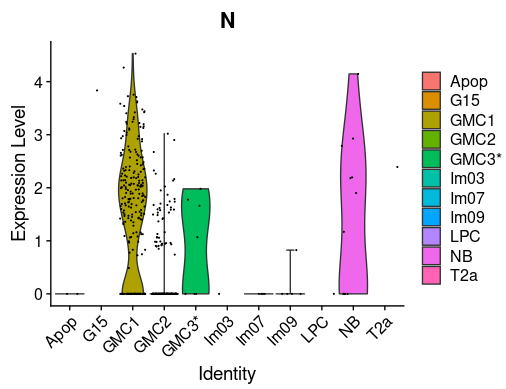
You can also visualize the expression of significant genes across different classes using feature plots or violin plots in Seurat.
Remember, the parameters like min.pct, logfc.threshold, and the p-value cutoff should be chosen based on your specific dataset and research questions. Adjust them as necessary to balance sensitivity and specificity.
Violin Plot
|
 |
|---|
|
scRNA-Seq: makers explore
https://karobben.github.io/2023/10/04/Bioinfor/scRNA-marker/


