Install
Quick Start
Reference:
library(ggplot2)c ("Male" , "Female" , "Child" ),c (25 , 25 , 50 )
group value1 Male 25 2 Female 25 3 Child 50
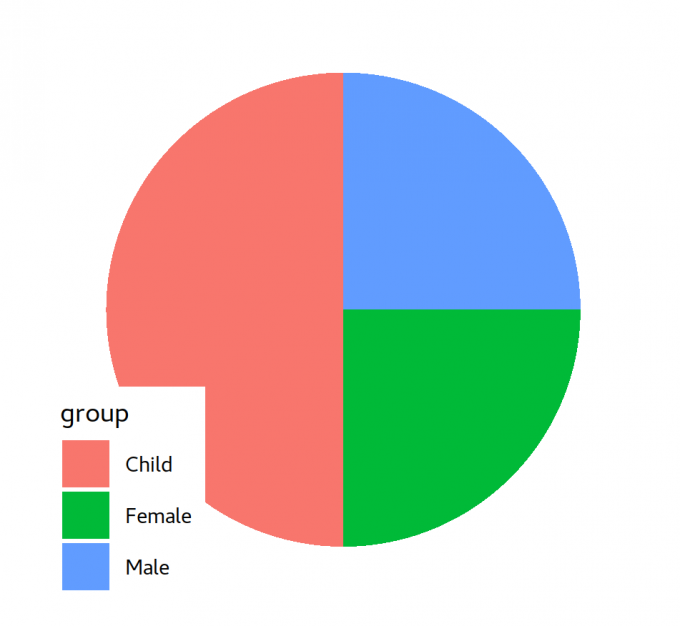
library(ggplot2)"" , y=value, fill=group))+1 , stat = "identity" ) + coord_polar("y" , start=0 ) + theme_map()"pie.png" , w=3.17 , h=2.92 )
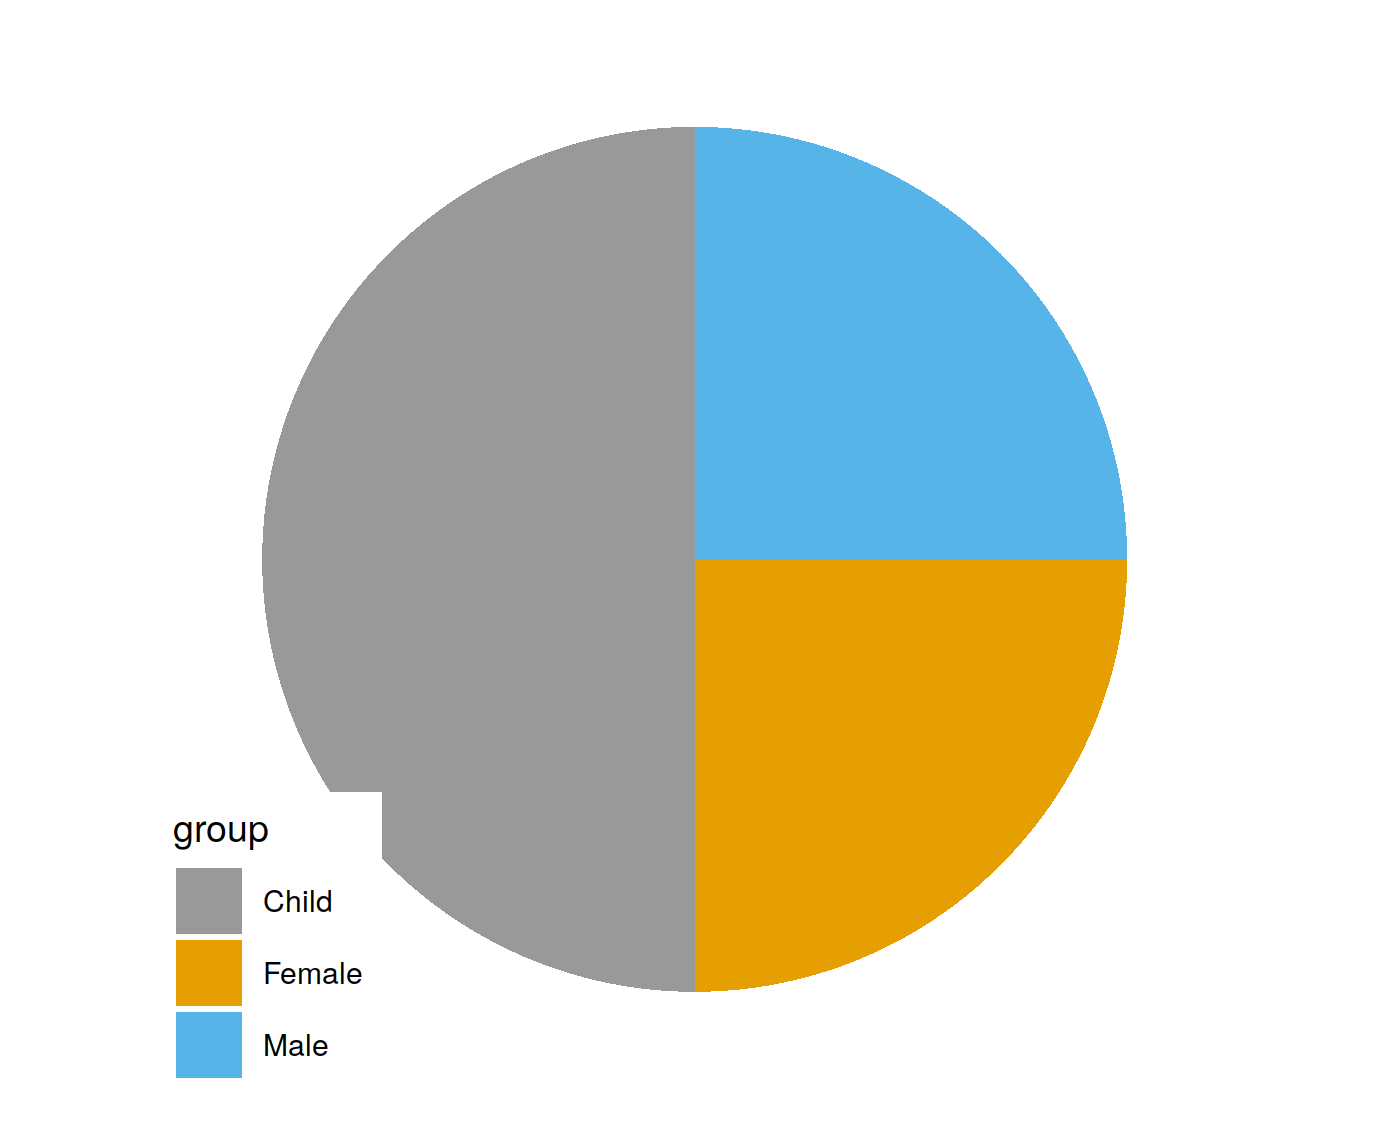
pie + scale_fill_manual(values=c ("#999999" , "#E69F00" , "#56B4E9" ))'pie2.png' , wi=4.6 , hei=3.76 )
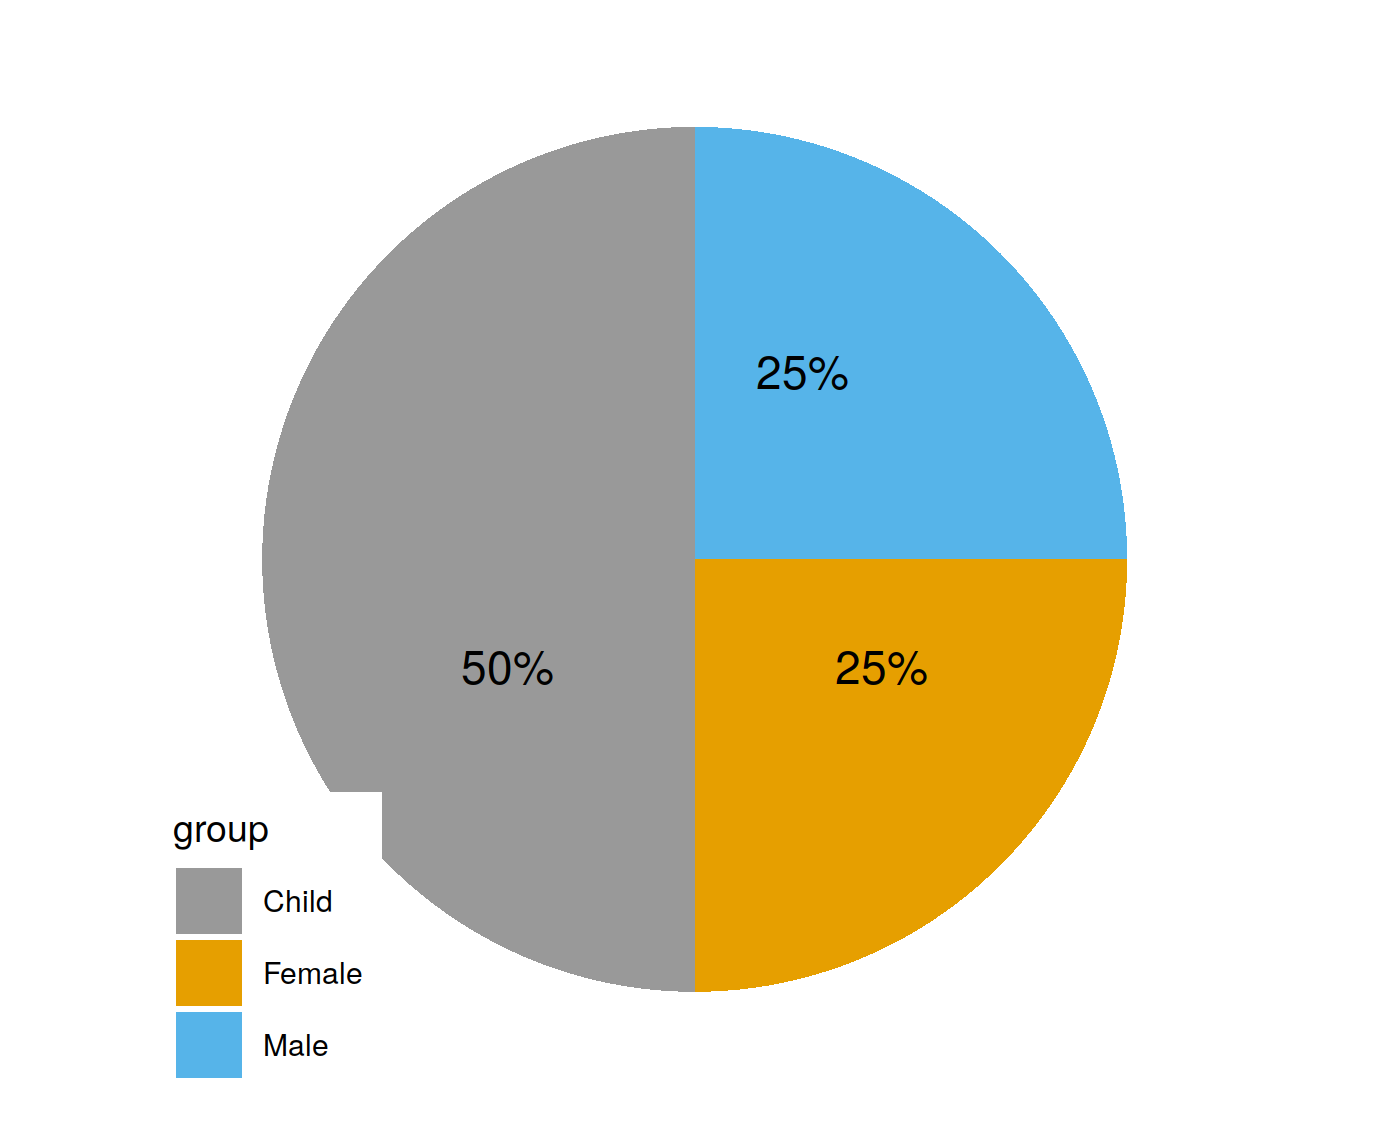
pie + scale_fill_manual(values=c ("#999999" , "#E69F00" , "#56B4E9" )) + geom_text(aes(y = value/3 + c (0 , cumsum (value)[-length (value)]), 100 /sum (value),"%" , sep='' )))
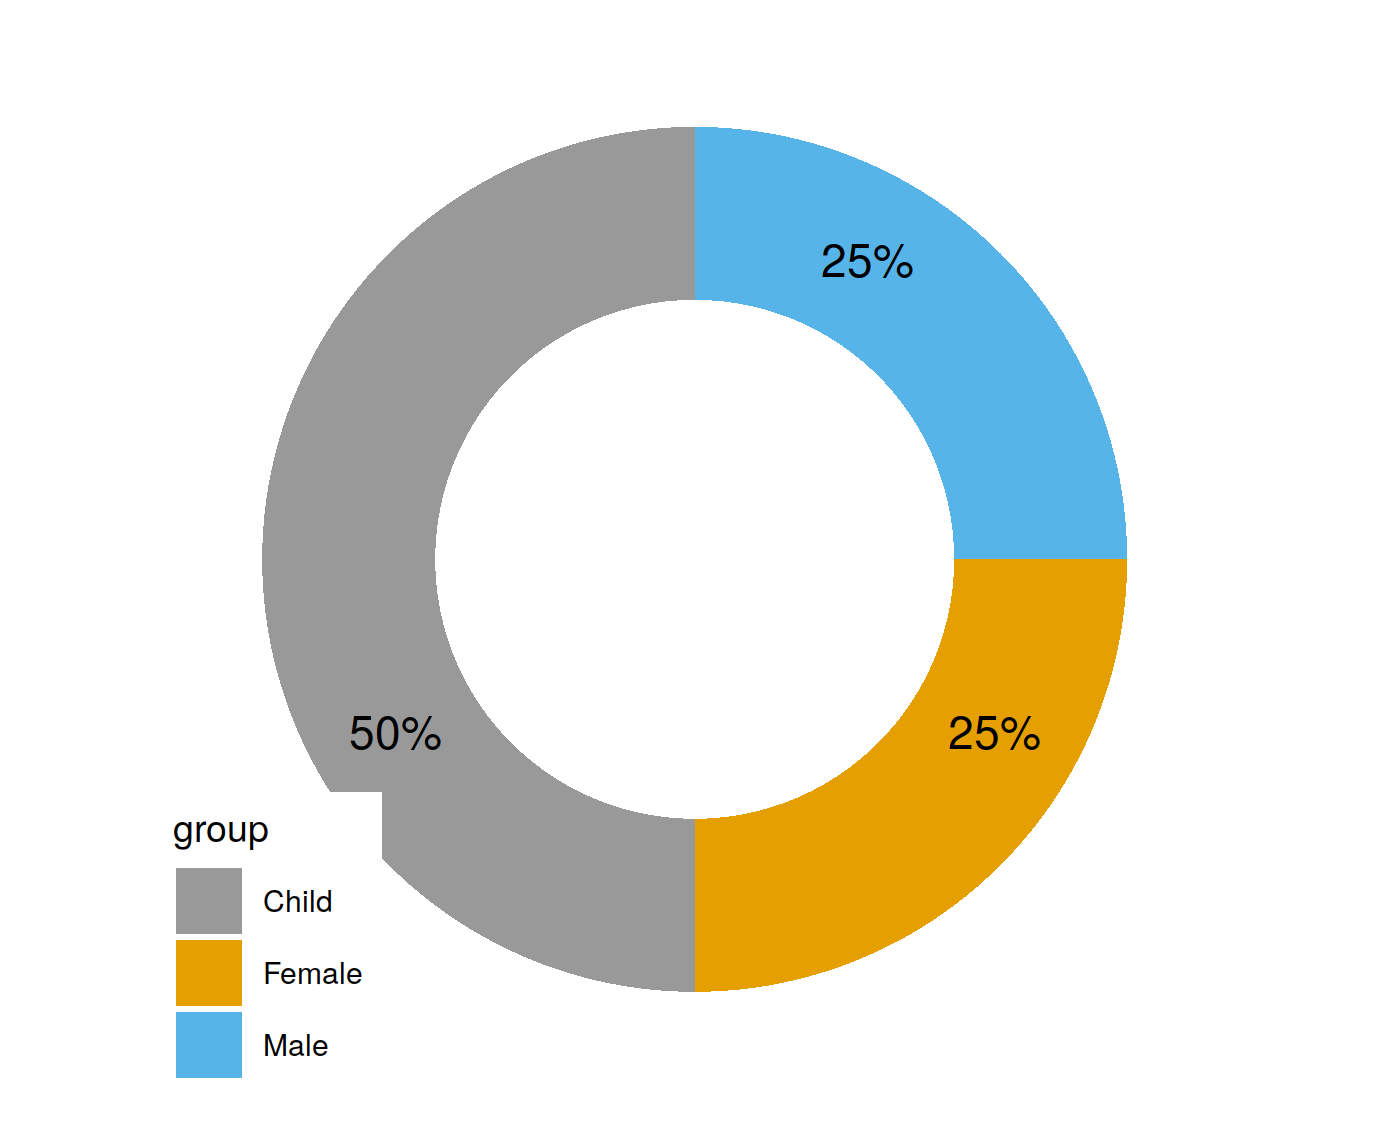
Ring pie
pie + scale_fill_manual(values=c ("#999999" , "#E69F00" , "#56B4E9" )) +3 + c (0 , cumsum (value)[-length (value)]), 100 /sum (value),"%" , sep='' )))+c (-1 ,1 ))
Multi-layer
TB = rbind(df,df)c (10 ,15 ,15 ,15 ,10 ,35 )c (rep ("A" ,3 ),rep ("B" ,3 ))1 :3 ,],aes(x="A" ,y=value[1 :3 ], fill=group),stat = 'identity' ) +"B" ,y =Sub, fill=Group),stat='identity' )+'y' )
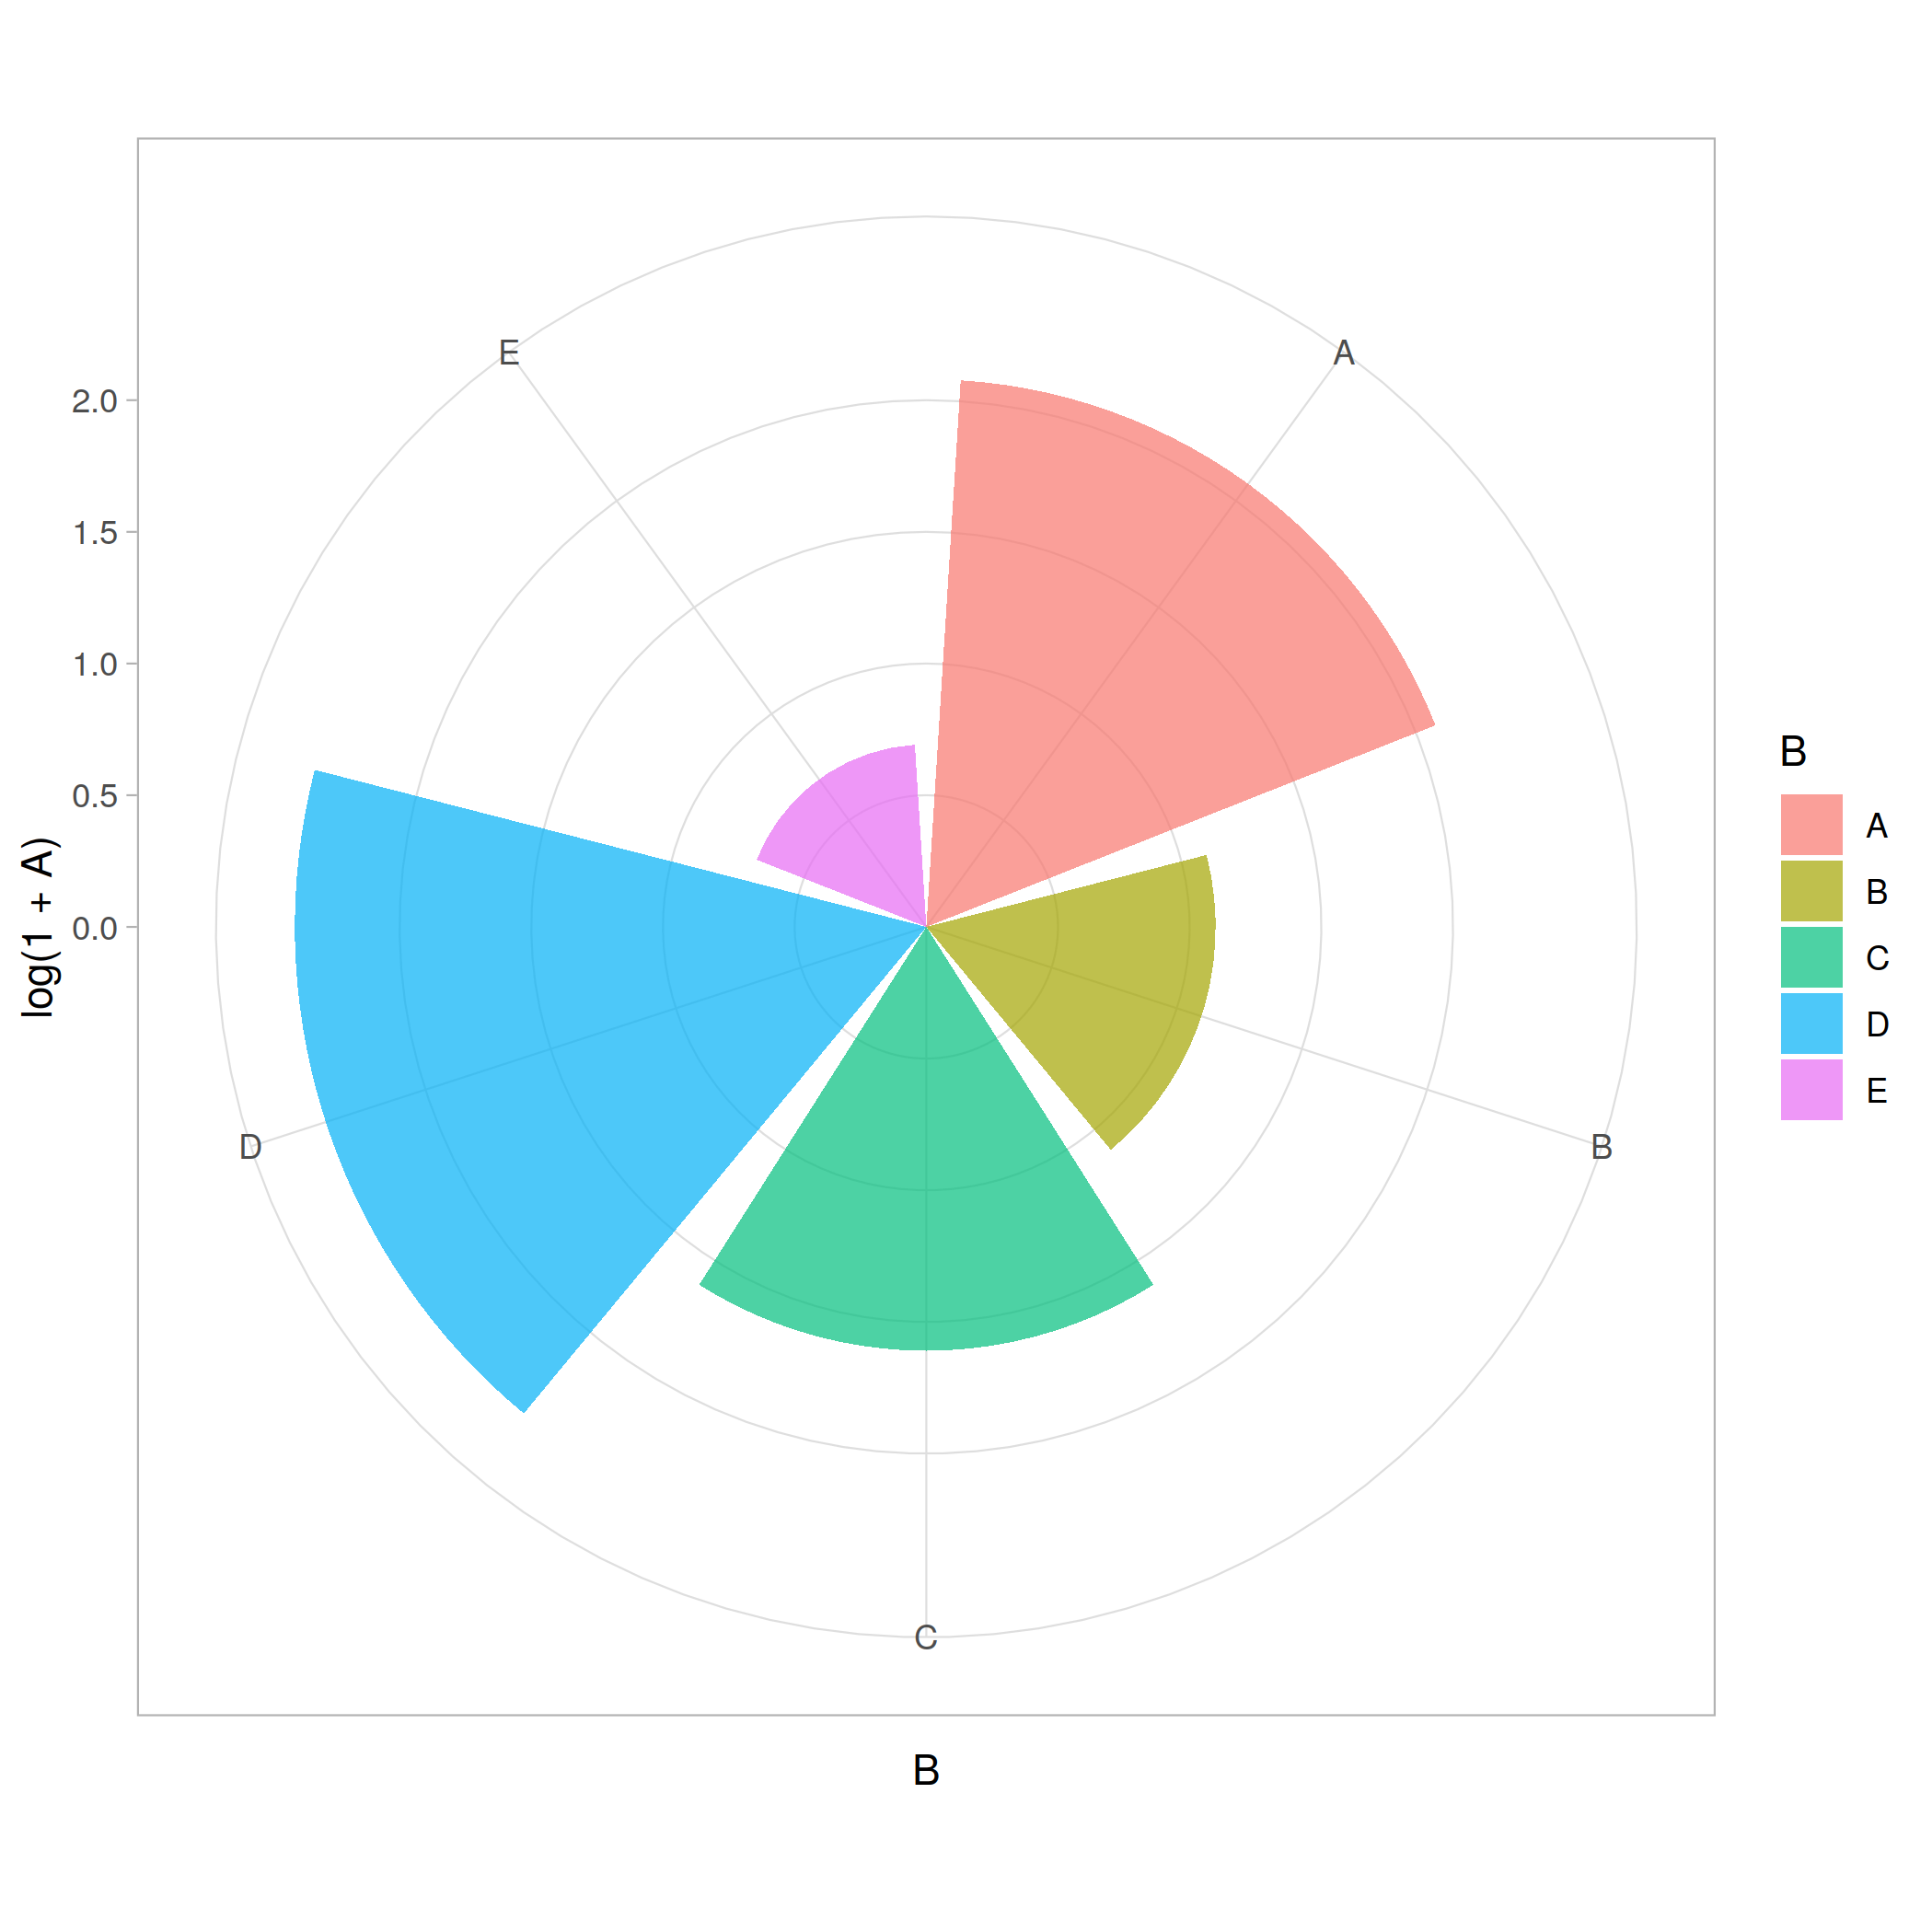
Rose Plot
Reference: 九茶
library(ggplot2)c (2 , 7 , 4 , 10 , 1 ), B = c ('B' ,'A' ,'C' ,'D' ,'E' ))log (1 +A), fill = B)) + "identity" , alpha = 0.7 ) +
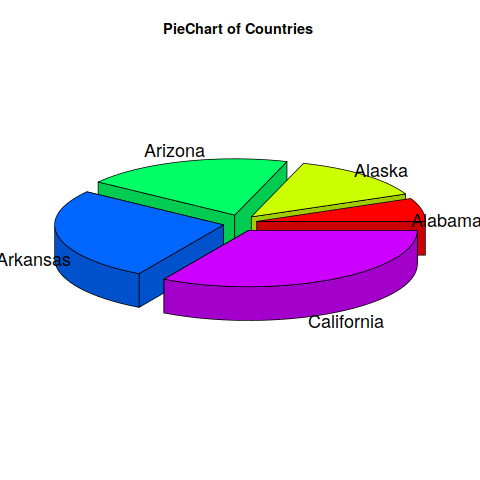
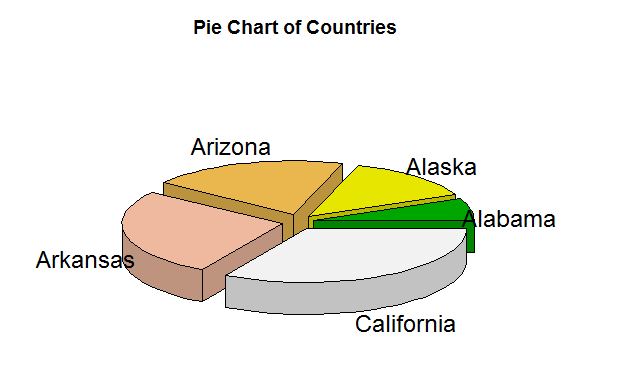
pie 3D
For pie3D, you’d like to install plotrix first.
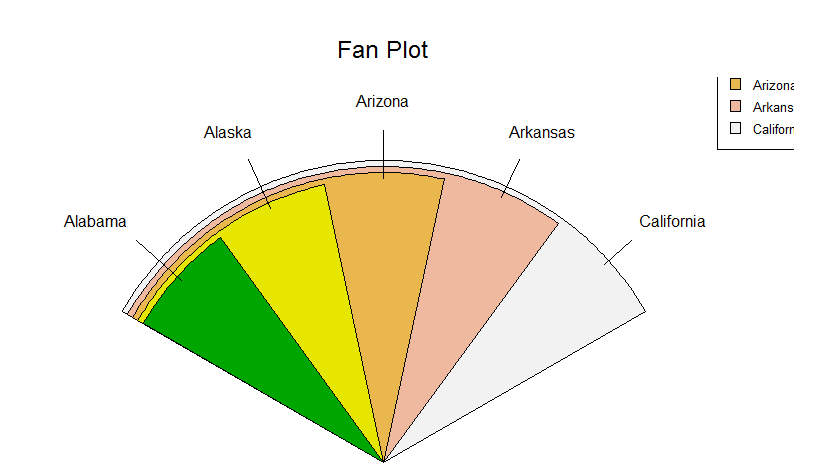
install.packages("plotrix" )"plotrix" )c (10 ,20 ,30 ,40 ,50 )c ("Alabama" , "Alaska" , "Arizona" ,"Arkansas" , "California" )0.1 ,main="PieChart of Countries " )
More
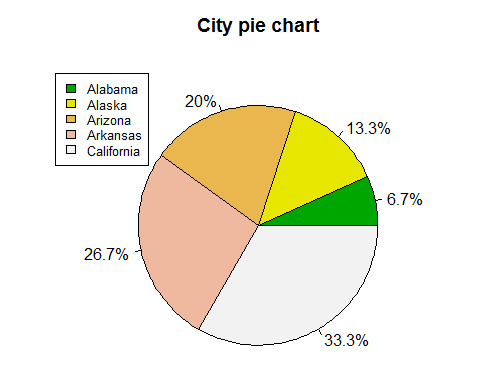
pie
author: 陈娜
© 陈娜 2015
