This guide illustrates how to visualize the range of available point shapes in the `ggplot2` package of R. By creating a data frame with a sequence of shape numbers and plotting them using `geom_point()`, users can easily identify and select suitable shapes for their data visualization needs. The resulting plot provides a clear representation of each shape, labeled with its respective shape number, allowing for quick and informed decisions in chart design.
To create 3D plots in Python, you can use the Matplotlib library. Matplotlib provides a toolkit called mplot3d, which allows you to create 3D plots using functions such as plot_surface, plot_wireframe, and scatter. You can customize the appearance of the plots by setting properties such as color, marker type, and line style.
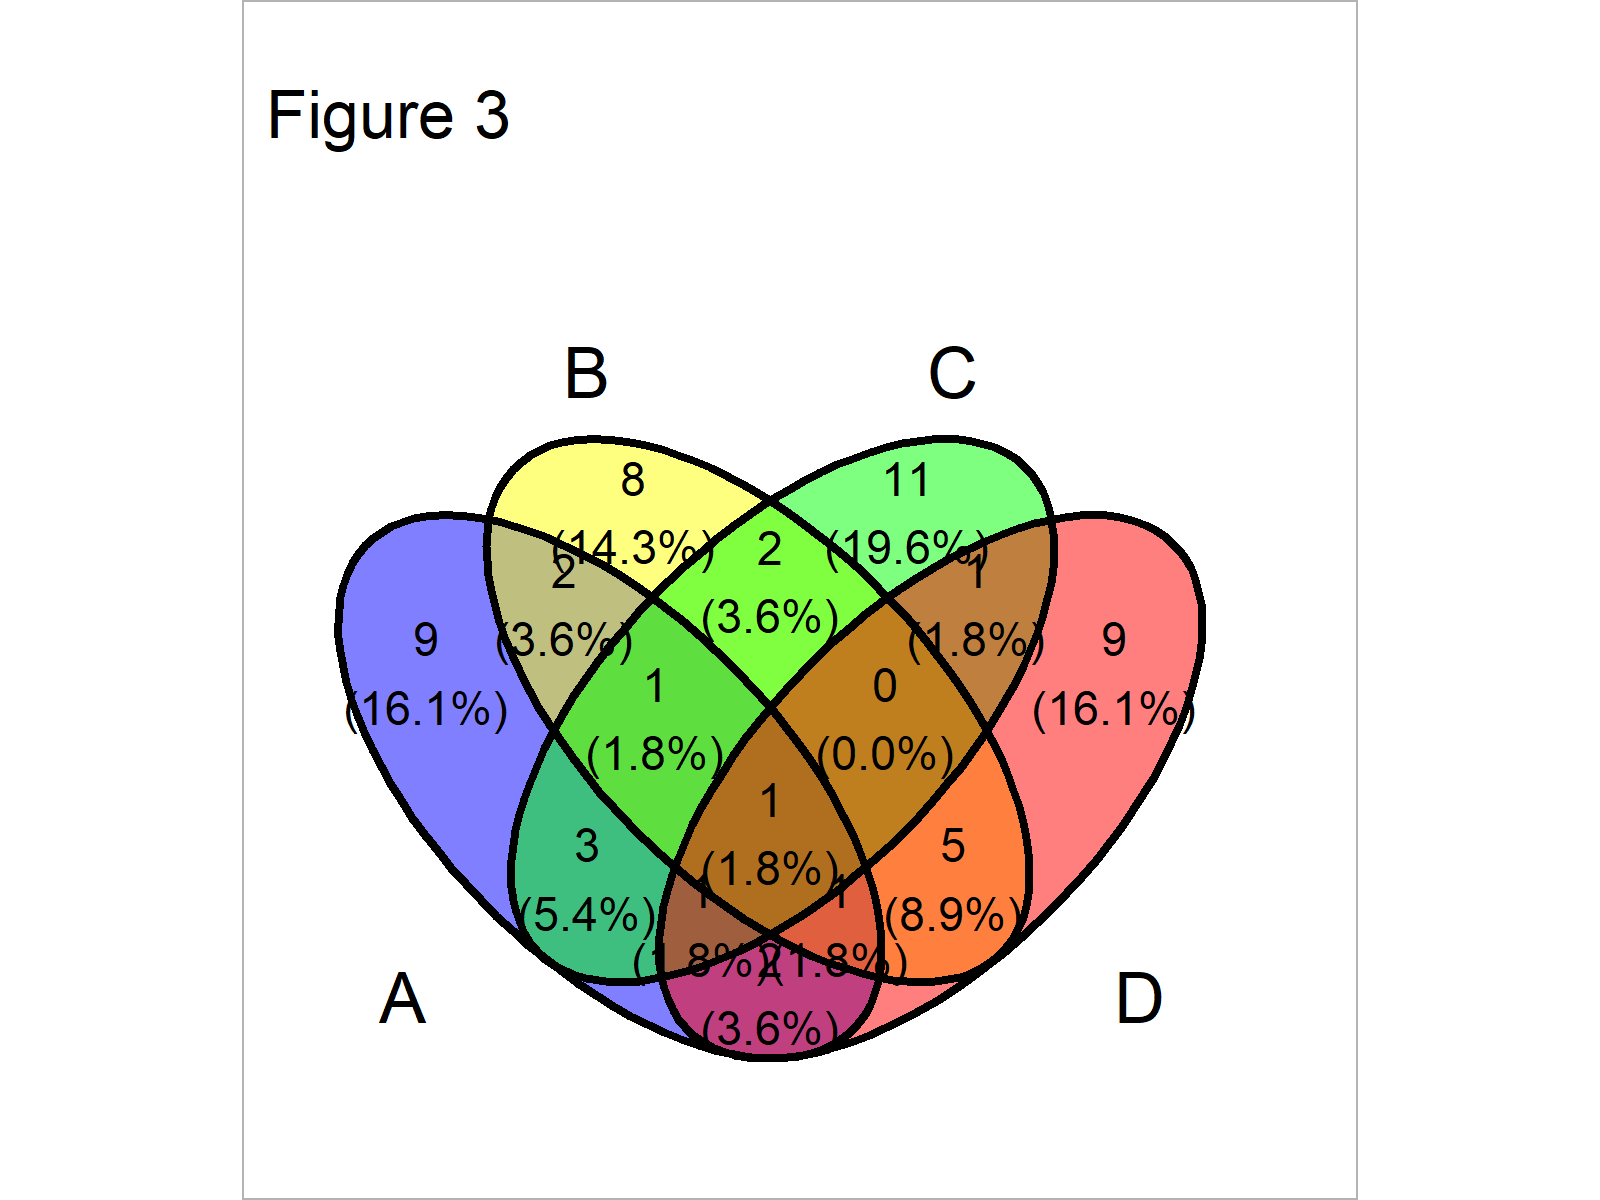
Venn plot is a visualization tool to display overlapping or unique sets between two or more groups. In R, the 'VennDiagram' package provides an easy-to-use interface to create Venn plots with customizable colors, labels, and shapes. Who sad this?
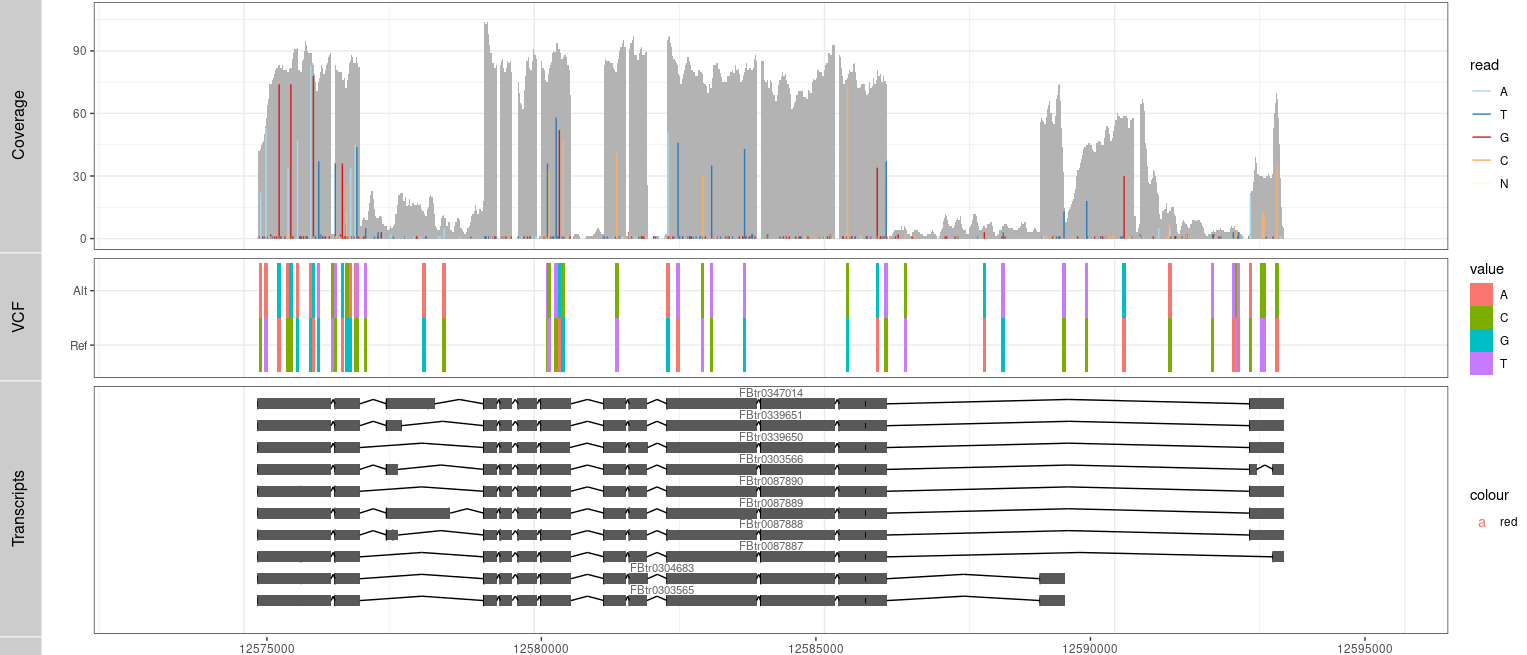
Dash-bio is a library that enables the creation of interactive, dynamic dashboards for exploring and analyzing biological data using Plotly Dash. With its customizable components and support for various data formats, dash-bio is a convenient tool for bioinformatics professionals and researchers Who sad this?
A 2D Density Plot is a way to display the distribution of data as a 2D heat map. It uses color-coding to represent areas of high and low density in a scatterplot, with darker colors indicating areas of higher density. It is useful for visualizing large datasets and identifying patterns in the data. Who said this?
 © Karobben
 © Karobben
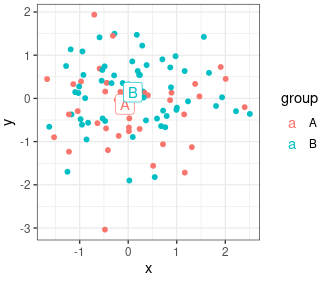 © Karobben
 © Karobben
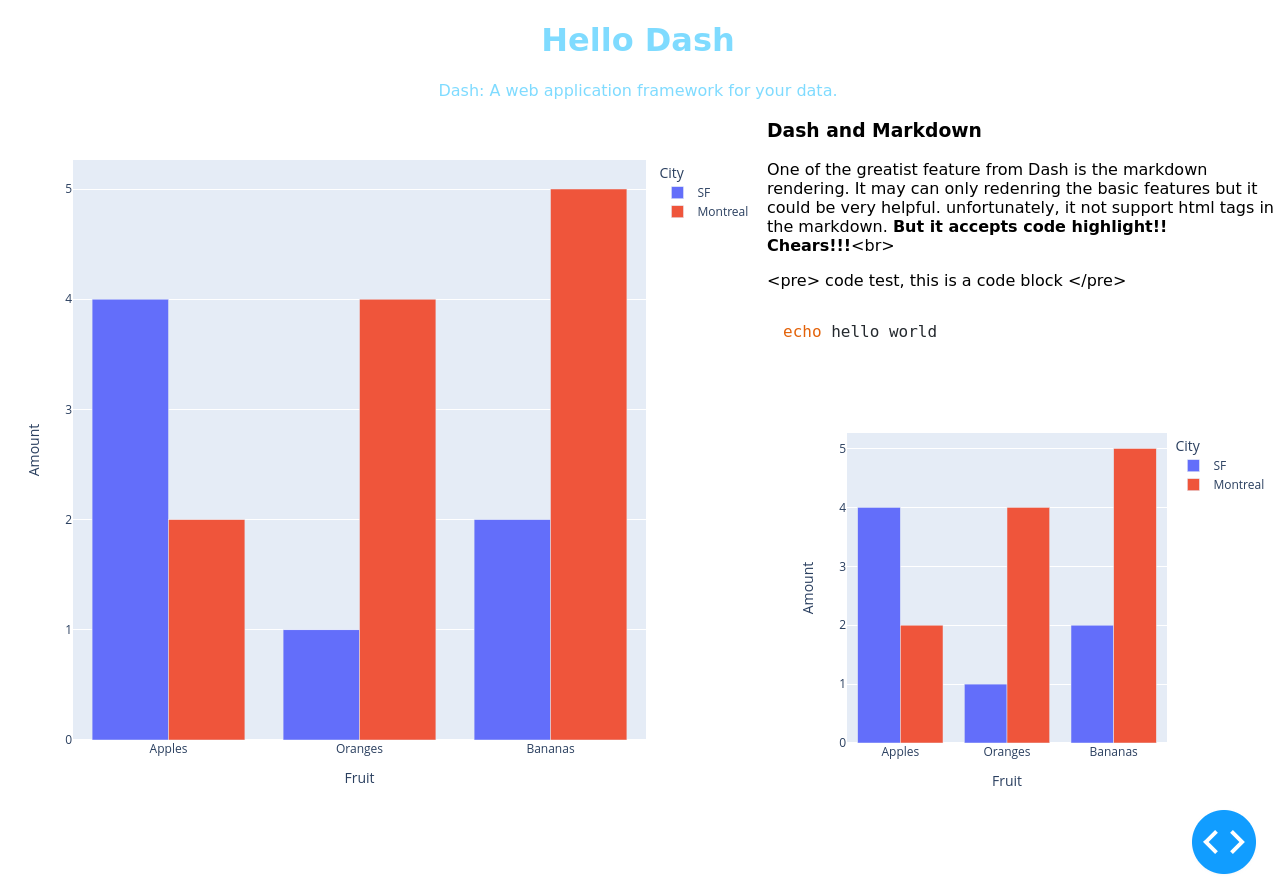 © Karobben
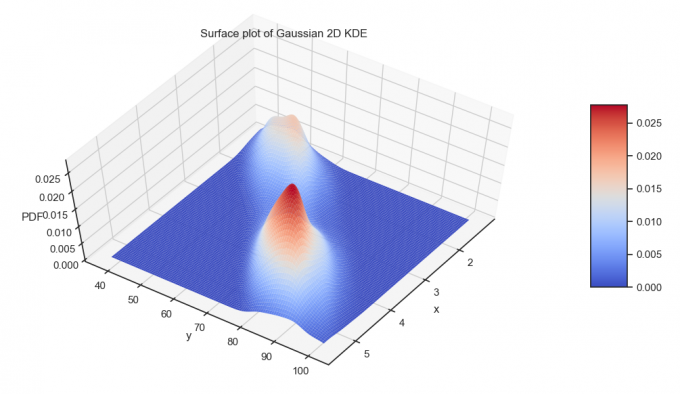 © Karobben
 © Karobben
 © Karobben
 © Karobben
 © Karobben
 © Apache ECharts