This guide illustrates how to visualize the range of available point shapes in the `ggplot2` package of R. By creating a data frame with a sequence of shape numbers and plotting them using `geom_point()`, users can easily identify and select suitable shapes for their data visualization needs. The resulting plot provides a clear representation of each shape, labeled with its respective shape number, allowing for quick and informed decisions in chart design.
ggplot is flexible, integrates well with igraph, and provides a consistent grammar for building plots, making it an ideal tool for creating informative, visually appealing, and reproducible visualizations of your network data. Who sad this?
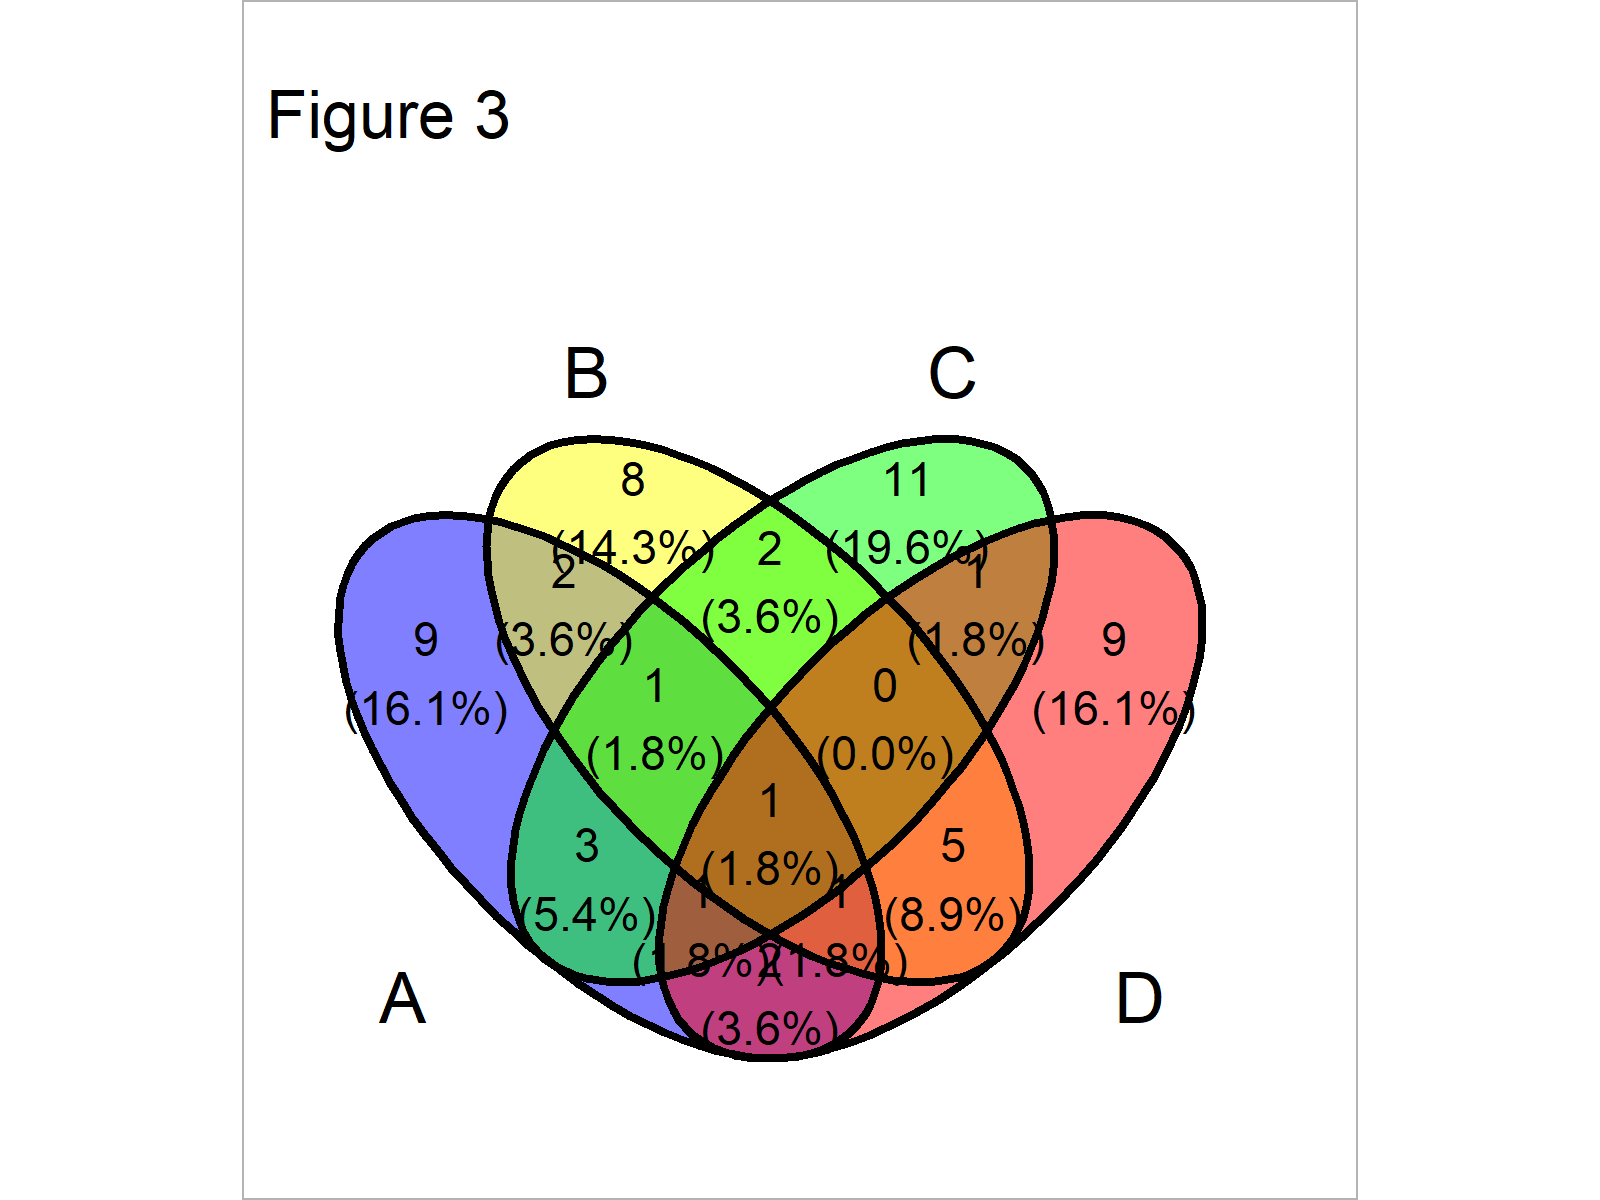
Venn plot is a visualization tool to display overlapping or unique sets between two or more groups. In R, the 'VennDiagram' package provides an easy-to-use interface to create Venn plots with customizable colors, labels, and shapes. Who sad this?
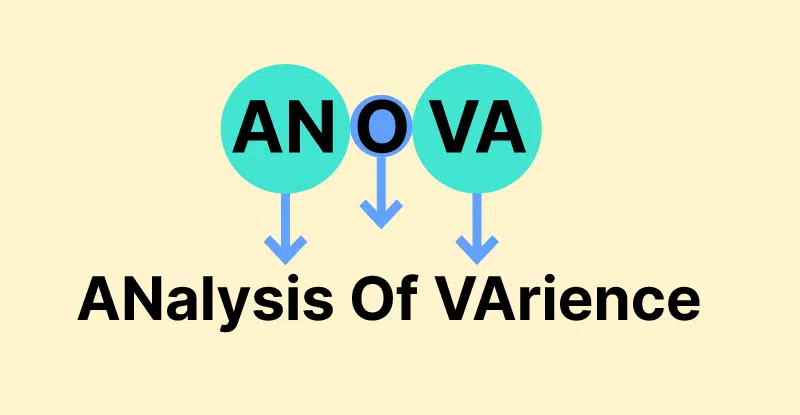
When we compare our control with another group, the t-test could fit our goal very well. But when we need to compare it into more than 1 group, 3 groups for example, the t-test could only give the random false positive independently. That means three false positives in three comparisons. This would cause a problem. Because the false positive we need to consider now is at least one false positive in three comparisons. It means we need to adjust the p-value and apply a rigorous method to achieve a more reliable result. For doing that, ANOVA was introduced and applied.
A binary tree is a type of tree data structure in which each node has at most two child nodes, typically referred to as the left child and right child. The nodes in a binary tree are arranged in a hierarchical order, with the topmost node called the root node. Who said this?
XGBoost (Extreme Gradient Boosting) is a popular open-source machine learning library used for classification and regression tasks. It is designed to improve upon the performance of traditional gradient boosting algorithms by adding additional regularization and optimizing the gradient descent algorithm. It is widely used in industry and has won several machine learning competitions. Who said this?
 © Karobben
 © Karobben
 © Karobben
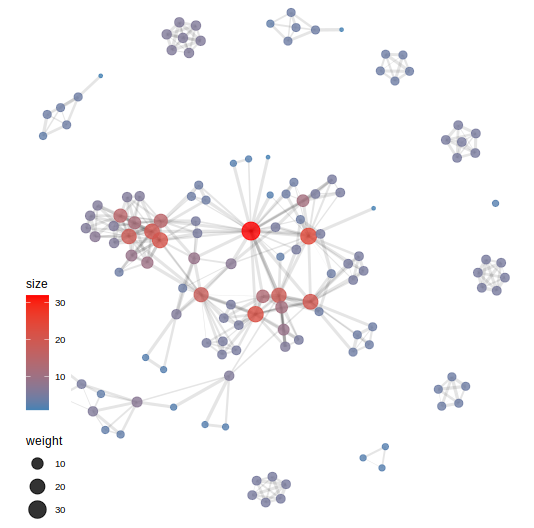 © Karobben
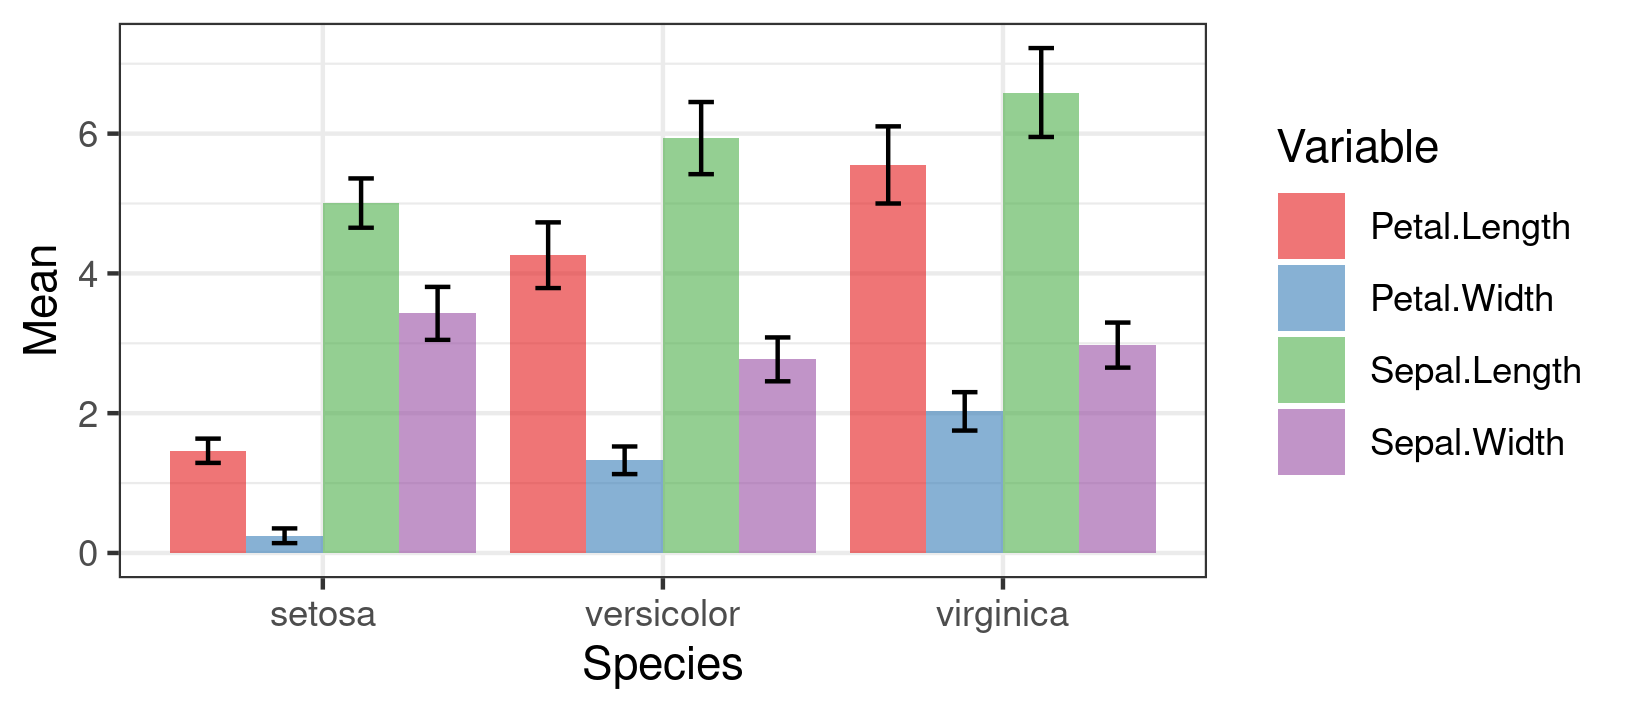 © Karobben
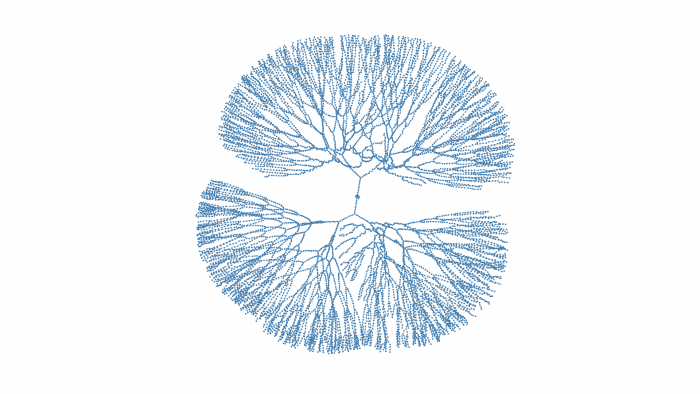 © Karobben
 © Karobben
 © Karobben