Pyhtnon: 2D Dengsity Plot© Karobben

Pyhtnon: 2D Dengsity Plot

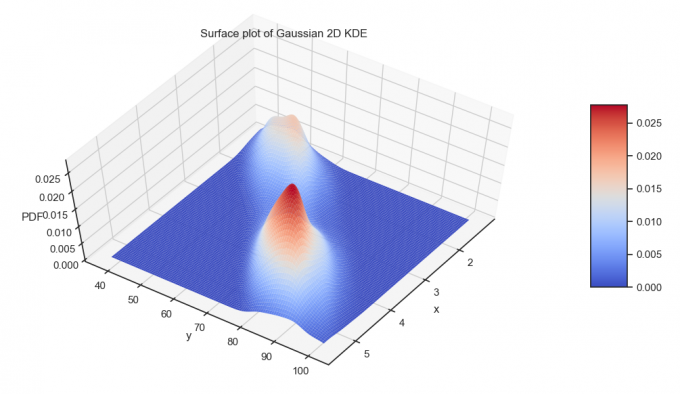
A 2D Density Plot is a way to display the distribution of data as a 2D heat map. It uses color-coding to represent areas of high and low density in a scatterplot, with darker colors indicating areas of higher density. It is useful for visualizing large datasets and identifying patterns in the data. Who said this?
Read more
Python GAM to fit© Karobben
A quick guide for seaborn plot in python© Karobben
wordcloud© Karobben

wordcloud

Wordcloud is a data visualization technique used to represent text data in a graphical format. In Python, the wordcloud library is used to generate wordclouds. It takes a text file or a string of text as input, and generates an image where the size of each word is proportional to its frequency in the input text. Who said this?
Read more

Basmap

Basemap is a Python library that provides a set of map projections and tools for plotting data on maps. It allows you to create maps with various cartographic projections, add features like coastlines and rivers, and plot data points on top of the map. Basemap can be used to create static maps or embedded in interactive web applications. Who said this?
Read more
Matplotlib

Matplotlib

Matplotlib is a Python library used for data visualization, including creating graphs, charts, and plots. It offers a wide range of customization options and supports various output formats, including PDF, PNG, and SVG. Who said this?
Read more
Plot in the Terminal!!! 在终端里面画画!!© getcodify.com