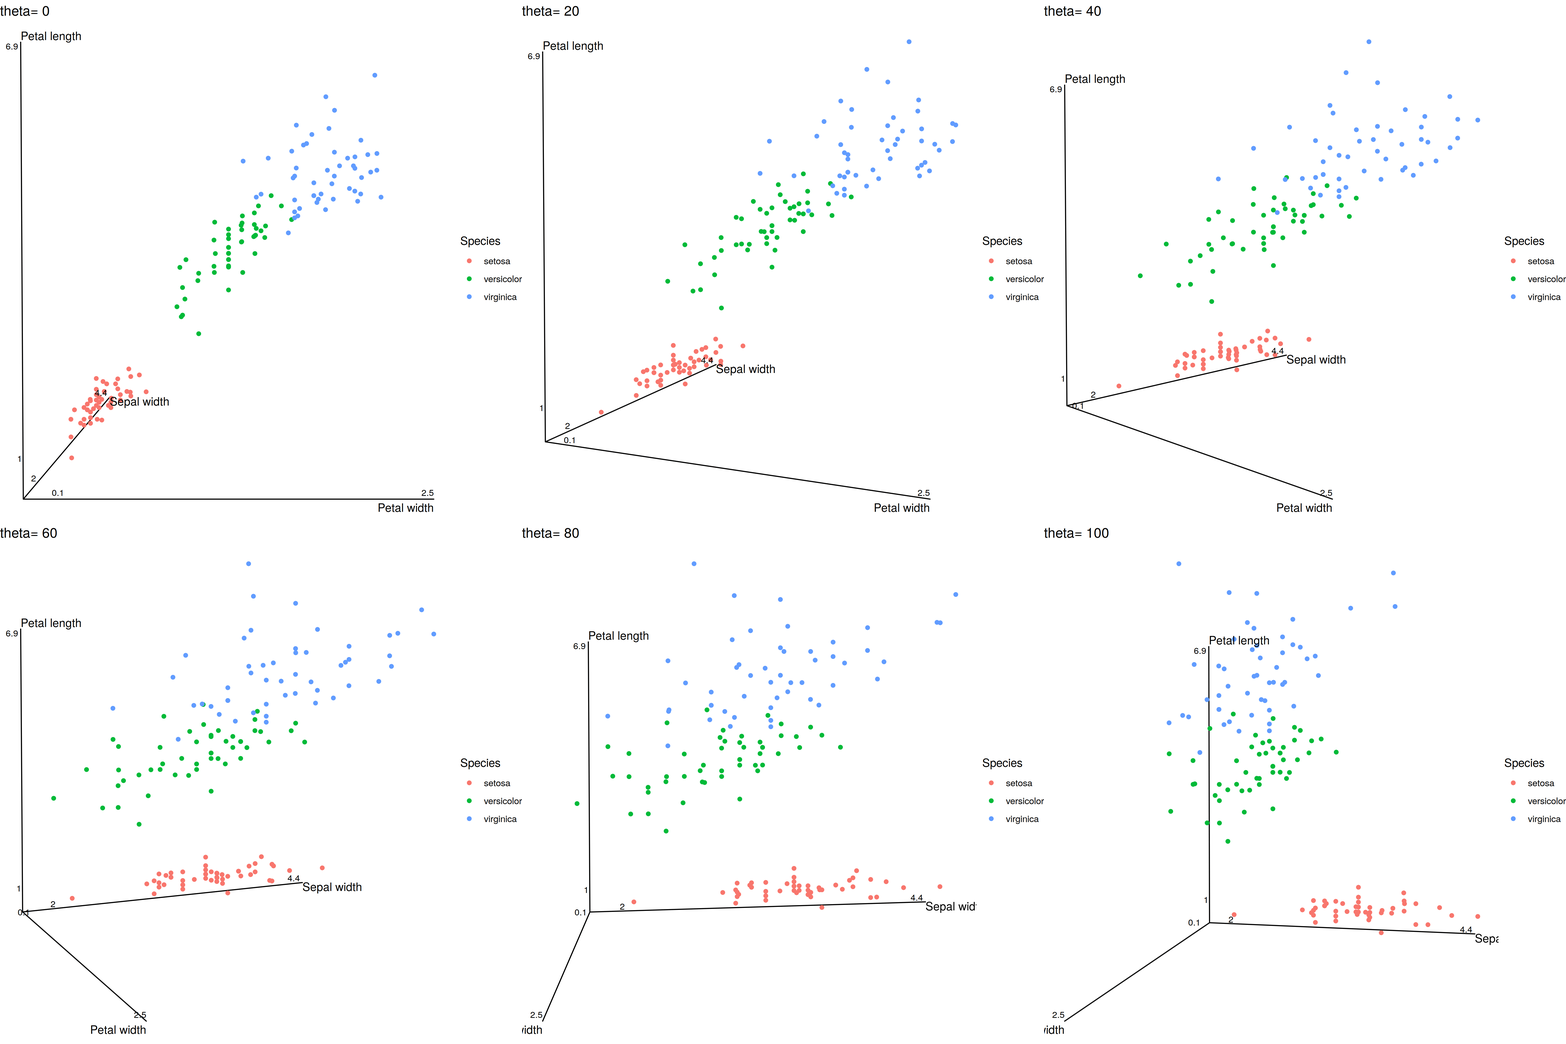
for(i in c(0:100)){
theta=i
phi=1
p <- ggplot(iris, aes(x=Petal.Width, y=Sepal.Width, z=Petal.Length, color=Species)) +
axes_3D(theta=theta, phi=phi) + stat_3D(theta=theta, phi=phi) +
axis_labs_3D(theta=theta, phi=phi, size=3, hjust=c(1,1,1.2,1.2,1.2,1.2), vjust=c(-.5,-.5,-.2,-.2,1.2,1.2)) +
labs_3D(theta=theta, phi=phi, hjust=c(1,0,0), vjust=c(1.5,1,-.2),labs=c("Petal width", "Sepal width", "Petal length")) +theme_void()+
labs(title =paste("theta=",i))
print(p)
}
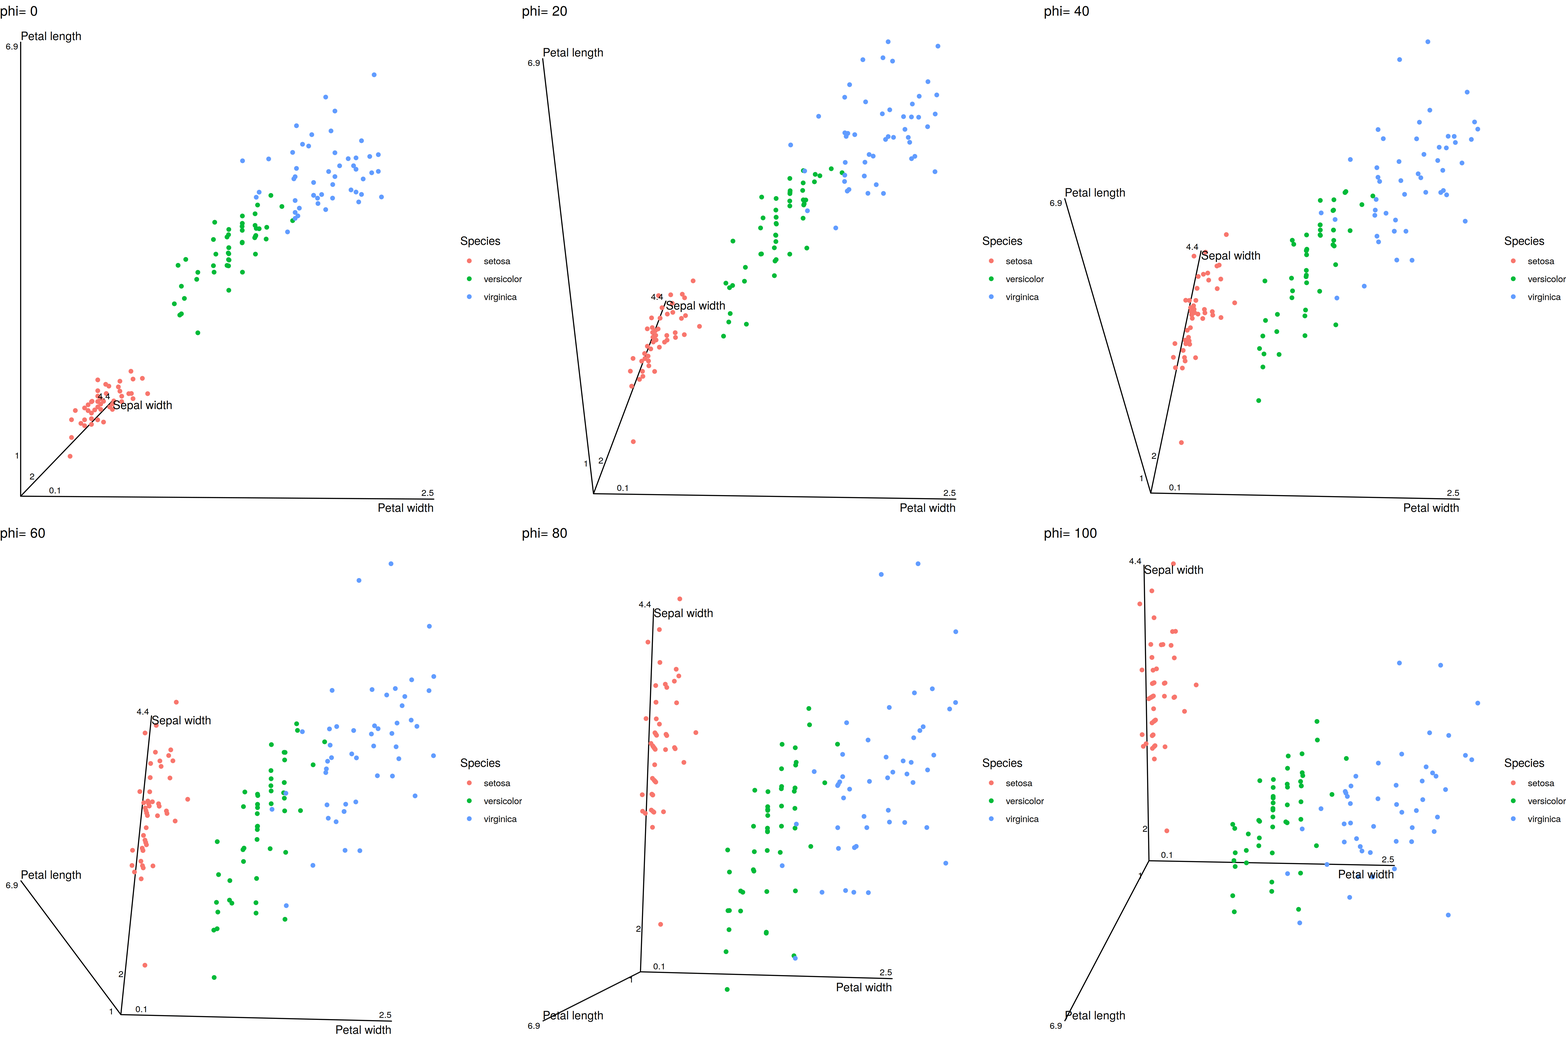
for(i in c(0:100)){
theta=1
phi=i
p <- ggplot(iris, aes(x=Petal.Width, y=Sepal.Width, z=Petal.Length, color=Species)) +
axes_3D(theta=theta, phi=phi) + stat_3D(theta=theta, phi=phi) +
axis_labs_3D(theta=theta, phi=phi, size=3, hjust=c(1,1,1.2,1.2,1.2,1.2), vjust=c(-.5,-.5,-.2,-.2,1.2,1.2)) +
labs_3D(theta=theta, phi=phi, hjust=c(1,0,0), vjust=c(1.5,1,-.2),labs=c("Petal width", "Sepal width", "Petal length")) +theme_void()+
labs(title =paste("phi=",i))
print(p)
}
|


