geom_curve | ggplot
Quick Start
|
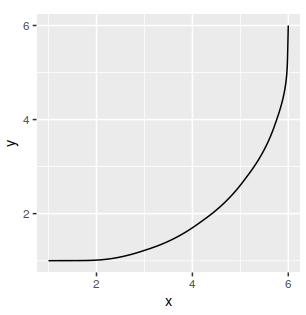
geom_segment draws a straight line between points (x, y) and (xend, yend).
geom_curve draws a curved line.
Arguments
ncp
|
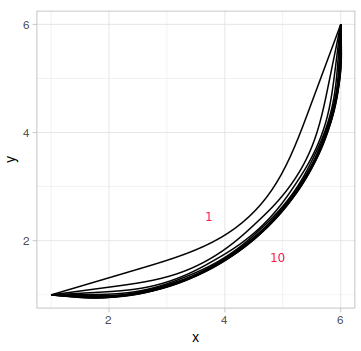
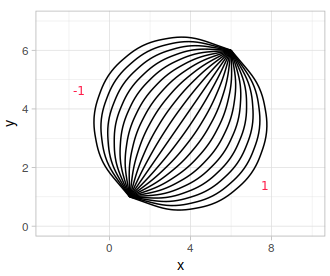
curvature
|
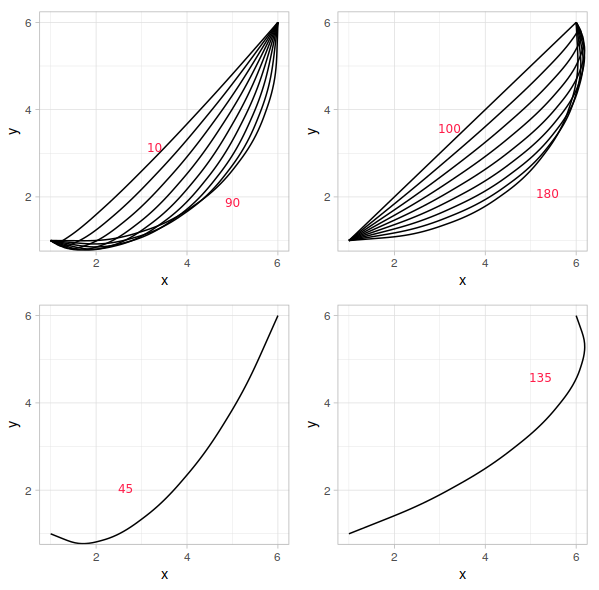
angle
|
geom_curve | ggplot
|
geom_segment draws a straight line between points (x, y) and (xend, yend).
geom_curve draws a curved line.
|
|
|
geom_curve | ggplot


