Quick Start
library(ggplot2)
library(ggtheme)
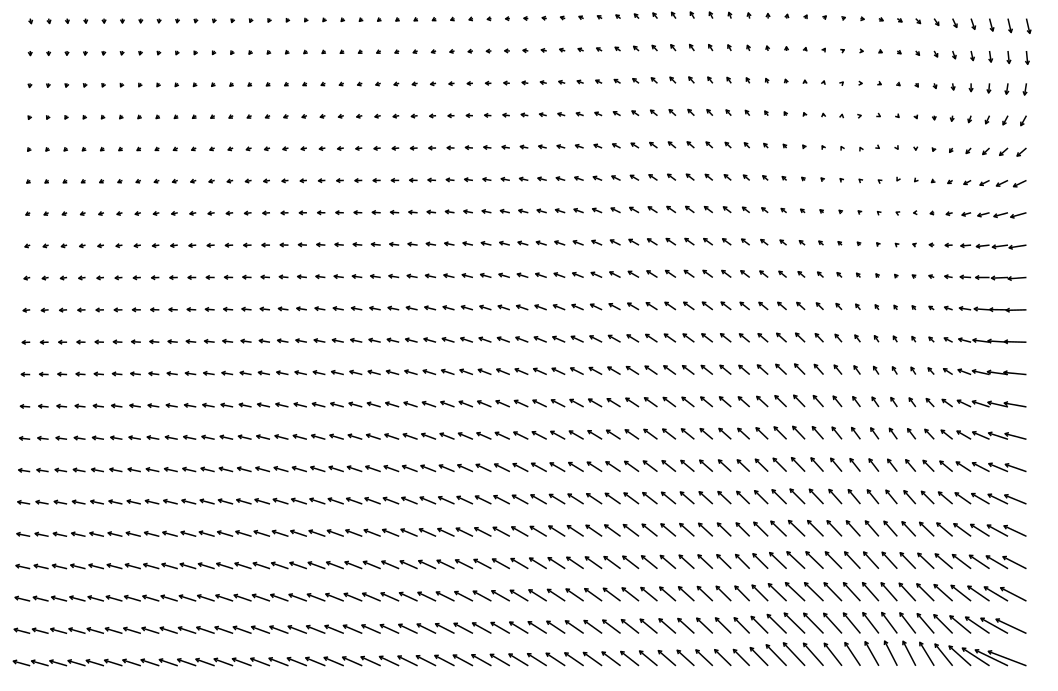
ggplot(seals, aes(long, lat)) + theme_map()
geom_segment(aes(xend = long + delta_long, yend = lat + delta_lat),
arrow = arrow(length = unit(0.1,"cm")))
|
length
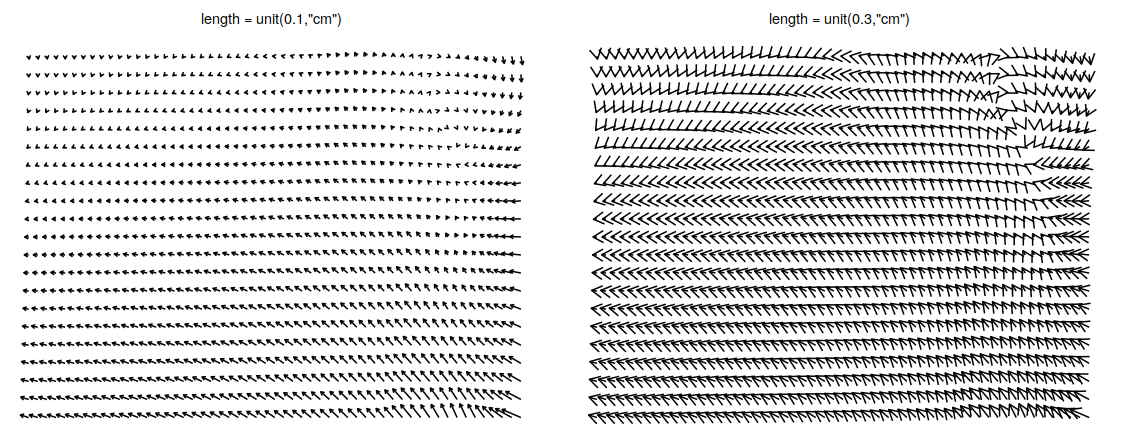
P1 <- ggplot(seals, aes(long, lat)) + theme_map()+ ggtitle('0.1')+
    geom_segment(aes(xend = long + delta_long, yend = lat + delta_lat),
    arrow = arrow(length = unit(0.1,"cm")))+
    theme(plot.title = element_text(hjust = 0.5))

P2 <- ggplot(seals, aes(long, lat)) + theme_map()+ ggtitle('0.3')+
    geom_segment(aes(xend = long + delta_long, yend = lat + delta_lat),
    arrow = arrow(length = unit(0.3,"cm")))+
    theme(plot.title = element_text(hjust = 0.5))

P1|P2
|
Bar
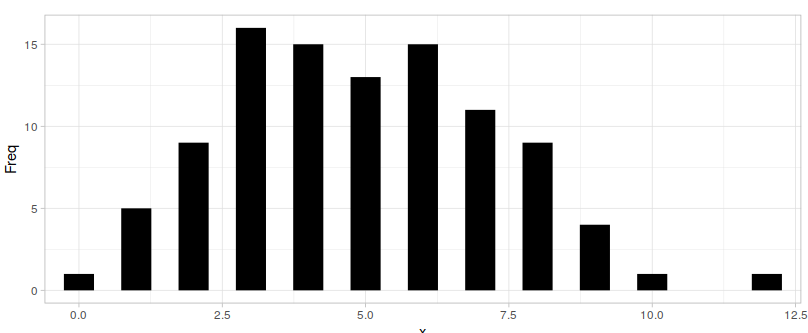
counts <- as.data.frame(table(x = rpois(100,5)))
counts$x <- as.numeric(as.character(counts$x))

ggplot(counts, aes(x, Freq)) + theme_light()
  geom_segment(aes(xend = x, yend = 0), size = 10, lineend = "butt")
|
geom_spoke
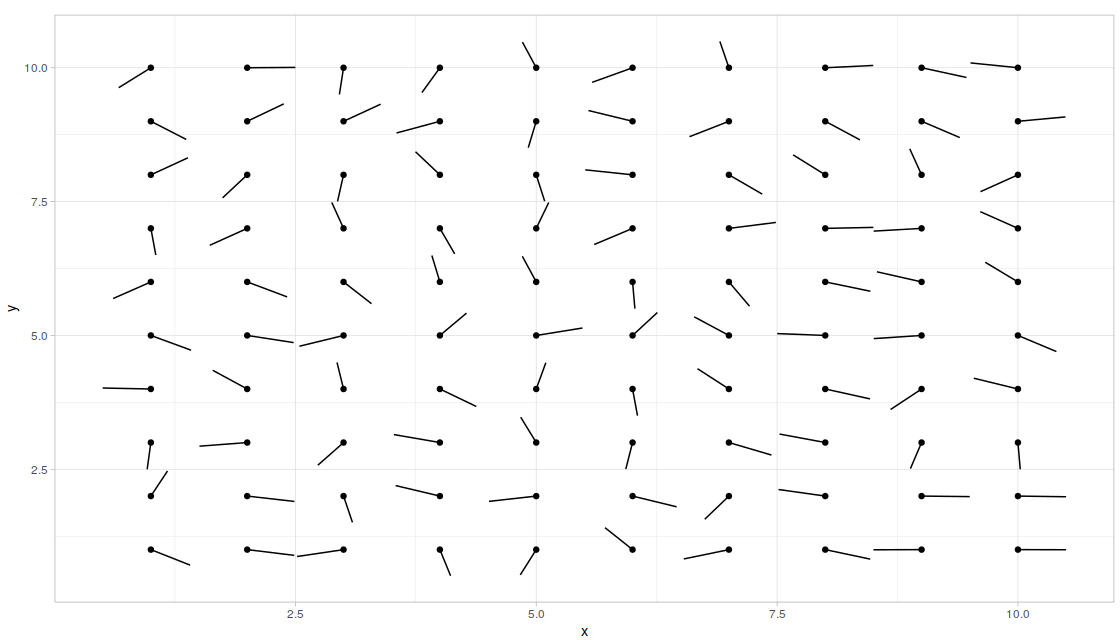
df <- expand.grid(x = 1:10, y=1:10)
df$angle <- runif(100, 0, 2*pi)
df$speed <- runif(100, 0, sqrt(0.1 * df$x))

ggplot(df, aes(x, y)) + geom_point() + theme_light()+
  geom_spoke(aes(angle = angle), radius = 0.5)
|
More


