library(ggplot2)

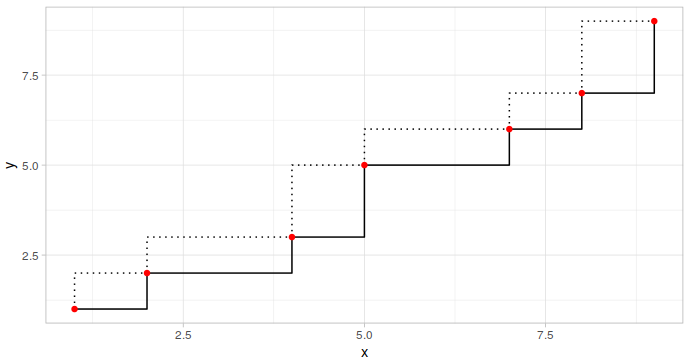
d=data.frame(x=c(1,2,4,5,7,8,9), y=c(1,2,3,5,6,7,9))

ggplot() + theme_light()+ geom_step(data=d, mapping=aes(x=x, y=y)) +
geom_step(data=d, mapping=aes(x=x, y=y), direction="vh", linetype=3) +
geom_point(data=d, mapping=aes(x=x, y=y), color="red")
|


