Graphviz
1 Quick Start
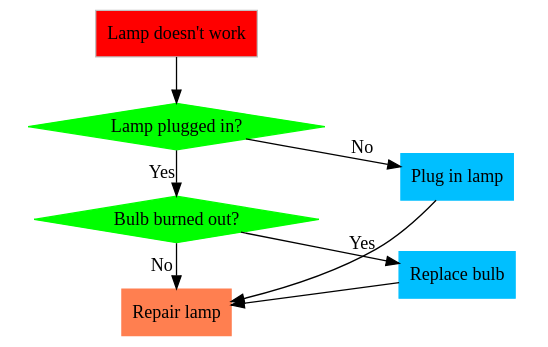
digraph F {"Lamp doesn't work" , shape = box, fillcolor = "#FF0000" ];"Repair lamp" , shape = box, color = coral];"Lamp plugged in?" , shape = diamond, color = green, size = 3 ];"Bulb burned out?" , shape = diamond, color = green, size = 3 ];"Replace bulb" , shape = box, color = deepskyblue1];"Plug in lamp" , shape = box, color = deepskyblue1];
``$`graphvizrankdir = LR;"node1" [ label = "{<f1> ADP |<f2> Pi }" shape = "record" "node2" [ label = "<f0> ATP| <f1> Ca" shape = "record"
remove the “$” from code above
More exemples:
http://graphviz.org/gallery/
2 Parameters
2.1 Structure
Source:https://graphviz.gitlab.io/_pages/doc/info/lang.html
graph : [ strict ] (graph | digraph) [ ID ] '{' stmt_list '}' ';' ] stmt_list ]'=' ID'[' [ a_list ] ']' [ attr_list ]'=' ID [ (';' | ',' ) ] [ a_list ]':' ID [ ':' compass_pt ]':' compass_pt'{' stmt_list '}' c | _)
A -> {B C}
color for edge
Official Documentation
Source: http://graphviz.org/documentation/
Nodes,edges …
Souce: https://graphviz.gitlab.io/_pages/doc/info/attrs.html
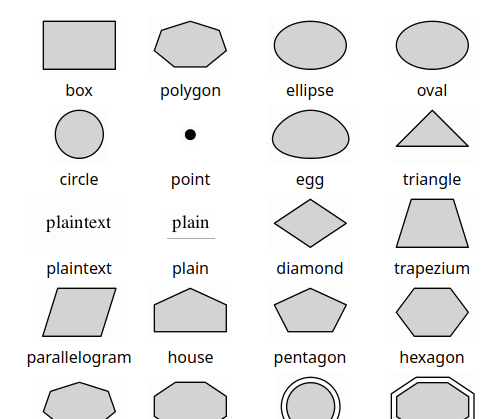
Node shapes
Source: https://graphviz.gitlab.io/_pages/doc/info/shapes.html
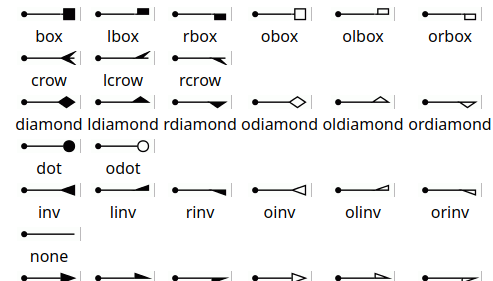
Edge shapes
digraph F {rankdir ="LR" arrowhead = "box" , color="green"] arrowhead = "crow" , style = "dotted" ]arrowhead = "dot" , weight = 10 ]arrowhead = "diamond" , headport="s"] arrowhead = "none" ]arrowhead = "icurve" ]style=filled; color=lightgrey; style=filled,color=white]; label = "process #1" ;
Source: https://graphviz.gitlab.io/_pages/doc/info/arrows.html
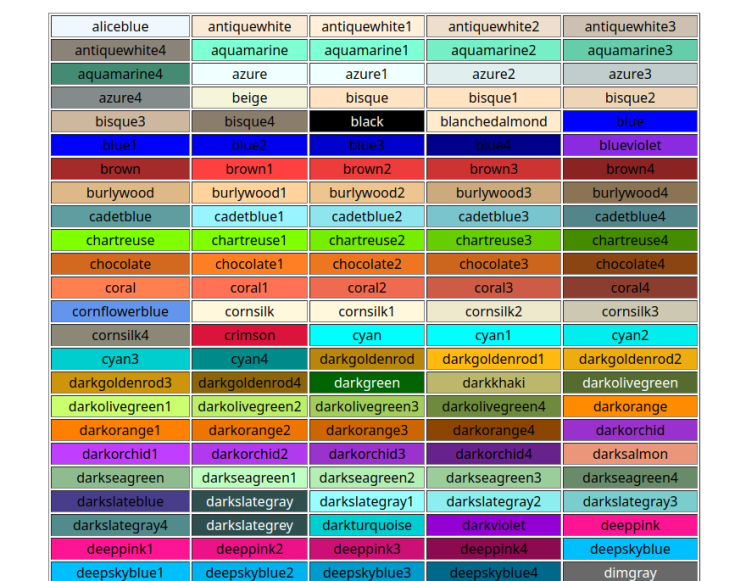
Color
Source: https://graphviz.gitlab.io/_pages/doc/info/colors.html
Edge
headport / tailport
A -> n [headport = "n"]
Style
A -> dashed [ style = "dashed"]
Multi-color
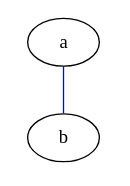
a -> b [dir=both color="red:blue"]c -> d [dir=none color="green:red;0.25:blue"]
Cluster
style =filled;color =lightgrey;style =filled,color=white];"This is a cluster" ;
Model
For more
please visit:
使用graphviz绘制流程图(2015版)http://icodeit.org/2015/11/using-graphviz-drawing/
