geom_bar | ggplot examples

geom_bar | ggplot examples

Here, we use mtcars as an example

Quick Start

library(ggplot2)
library(patchwork)

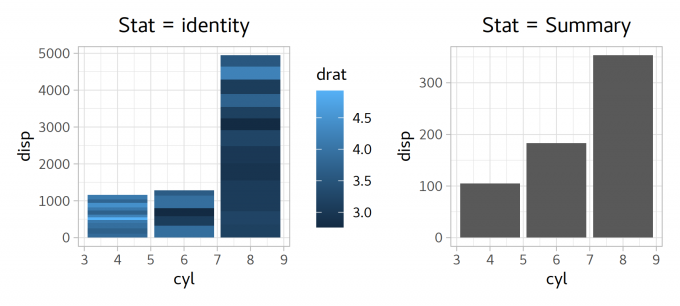
p1 <- ggplot(mtcars) + ggtitle("Stat = identity") + # Adding Title
# Main function for bar plot
geom_bar(aes(cyl,disp, fill=drat), stat='identity') +
# Adding a Theme
theme_light()+
# Adjust the Position Title
theme(plot.title = element_text(hjust = 0.5))

p2 <- ggplot(mtcars) + ggtitle("Stat = Summary") +
geom_bar(aes(cyl, disp,fill=drat), stat='summary') +
theme_light()+
theme(plot.title = element_text(hjust = 0.5))

p1|p2
## Saving the plot
ggsave("bar.png",w=5.95, h=2.68)

aQea6O.md.png]

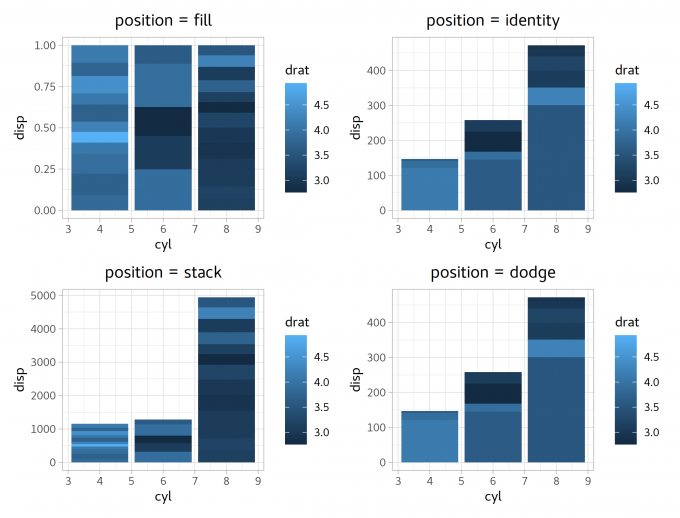
State = identity

p1 <- ggplot(mtcars) +
geom_bar(aes(cyl, disp,fill=drat), stat='identity', position = 'fill') +
theme_light() + ggtitle("position = fill")+
theme(plot.title = element_text(hjust = 0.5))

p2 <- ggplot(mtcars) +
geom_bar(aes(cyl, disp,fill=drat), stat='identity', position = 'identity') +
theme_light() + ggtitle("position = identity")+
theme(plot.title = element_text(hjust = 0.5))


p3 <- ggplot(mtcars) +
geom_bar(aes(cyl, disp,fill=drat), stat='identity', position = 'stack') +
theme_light() + ggtitle("position = stack")+
theme(plot.title = element_text(hjust = 0.5))


p4<- ggplot(mtcars) +
geom_bar(aes(cyl, disp,fill=drat), stat='identity', position = 'dodge') +
theme_light() + ggtitle("position = dodge")+
theme(plot.title = element_text(hjust = 0.5))

(p1|p2)/(p3|p4)
ggsave("bar2.png",w=7.46, h=5.68)

aQnfoj.md.png

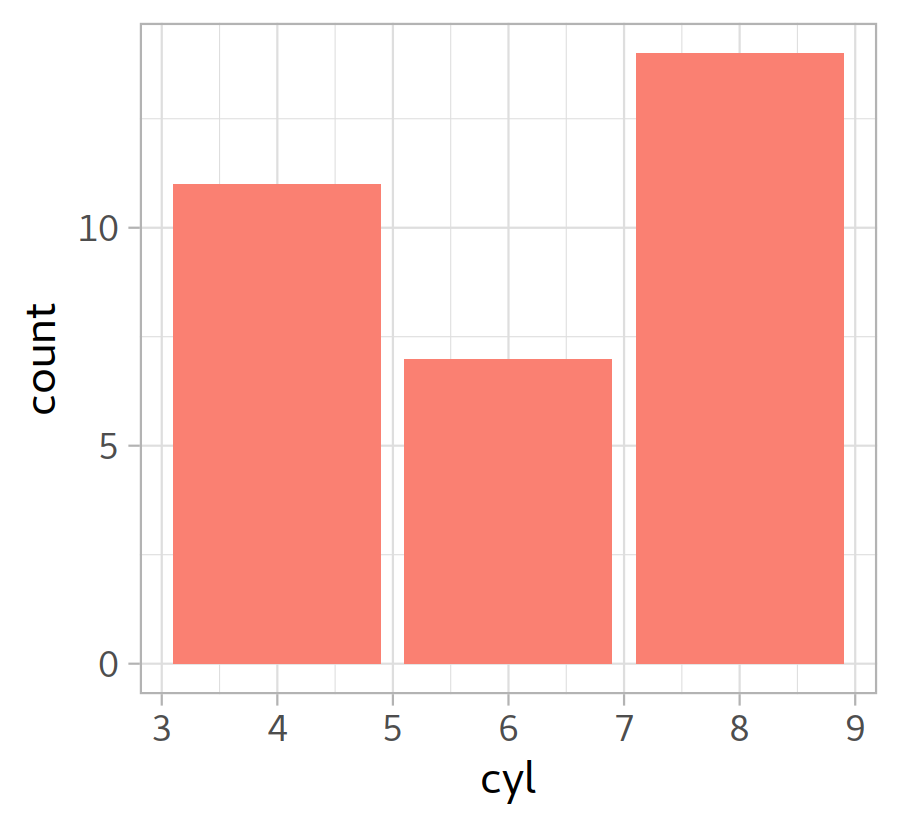
State = count

ggplot(mtcars) +
geom_bar(aes(cyl), fill='salmon') +
theme_light()

## The same as:
ggplot(mtcars) +
geom_bar(aes(cyl), fill='salmon', stat='count') +
theme_light()

ggsave("bar_salmon.png",w=3, h=2.76)

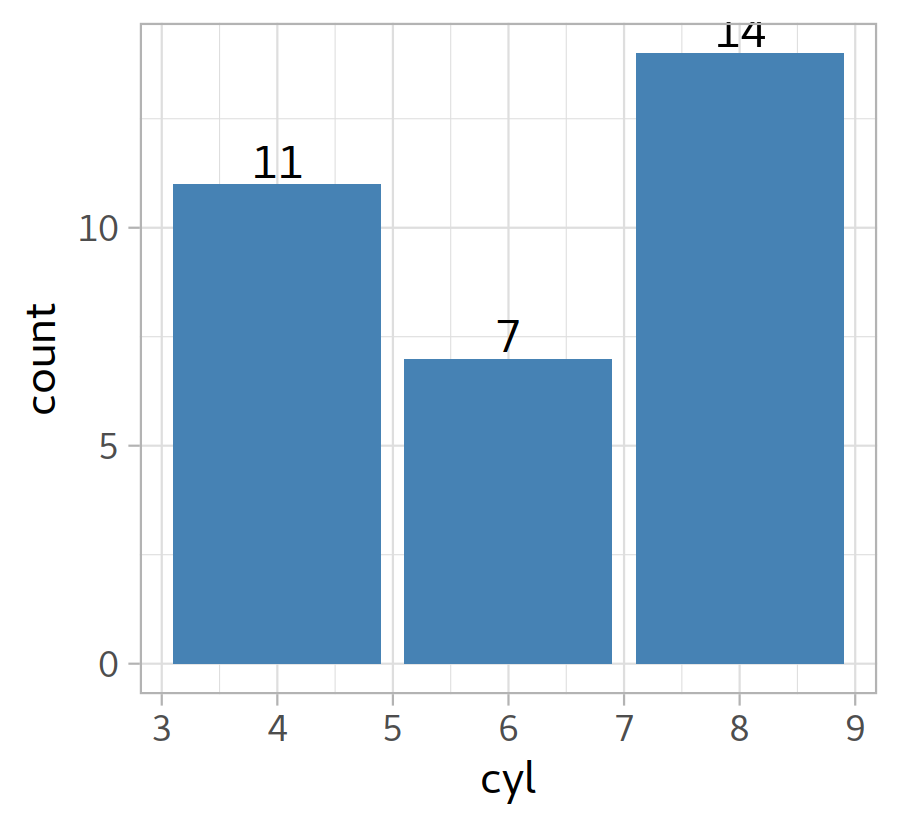
ggplot(mtcars) +
geom_bar(aes(cyl), fill='steelblue') +
theme_light() + geom_text(aes(x=cyl, label=..count..), stat = 'count', vjust = - 0.2)
ggsave("bar_steelblue.png",w=3, h=2.76)

sB8FWn.md.png sB3xL8.md.png
bar_salmon bar_steelblue
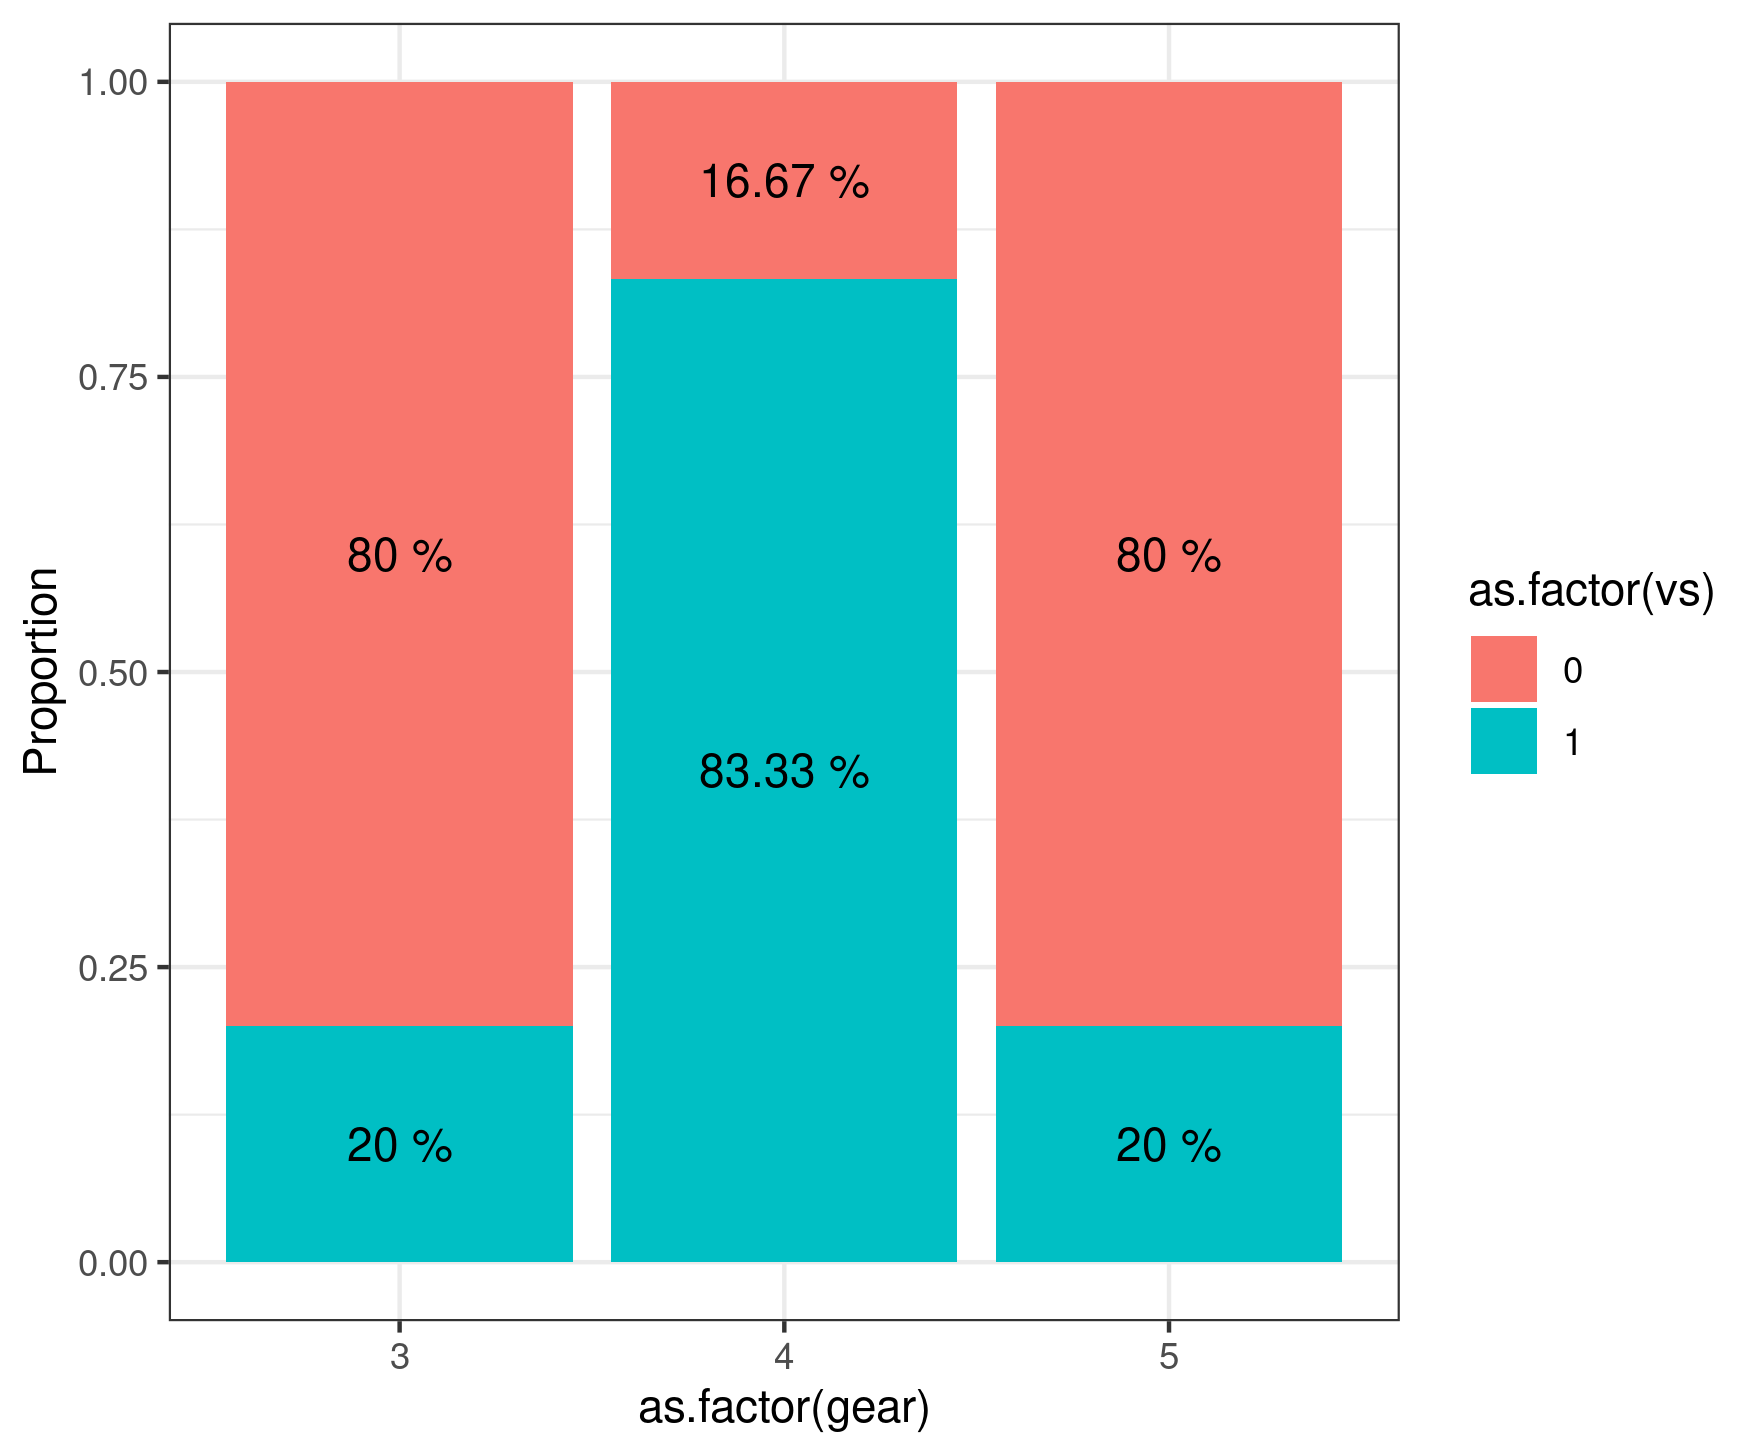
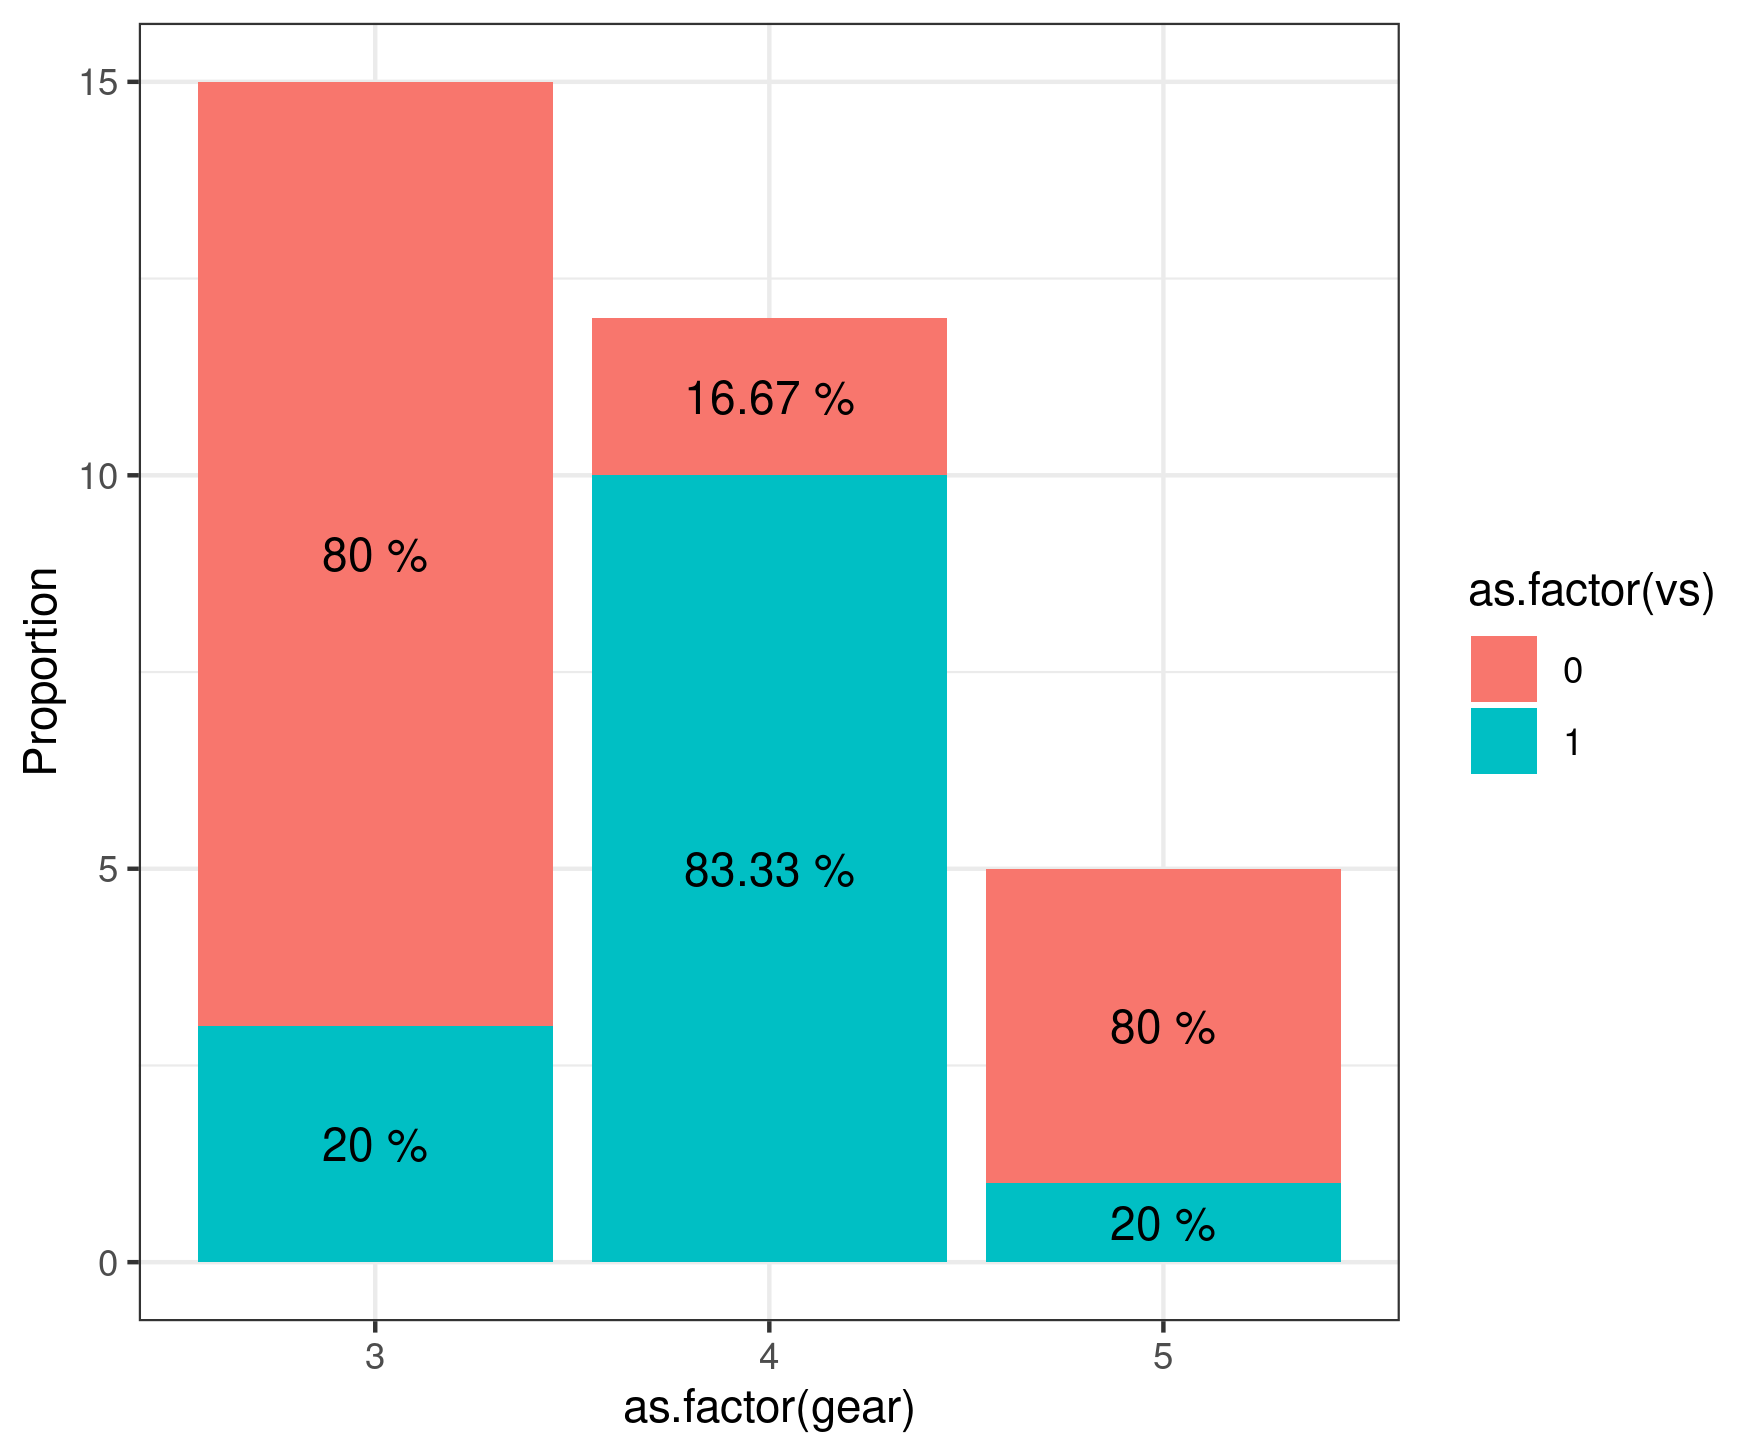
library(ggplot2)

ggplot(mtcars, aes(x=as.factor(gear), fill= as.factor(vs))) +
geom_bar(position="fill") +
geom_text(
aes(label=paste( 100*signif(..count.. / tapply(..count.., ..x.., sum)[as.character(..x..)], digits=4), "%")),
stat="count",
position=position_fill(vjust=0.5)) +
labs(y="Proportion") + theme_bw()

ggplot(mtcars, aes(x=as.factor(gear), fill= as.factor(vs))) +
geom_bar(position="stack") +
geom_text(
aes(label=paste( 100*signif(..count.. / tapply(..count.., ..x.., sum)[as.character(..x..)], digits=4), "%")),
stat="count",
position=position_stack(vjust=0.5)) +
labs(y="Proportion") + theme_bw()
Barplot fill Barplot Stack

position

Reference: Dwzb

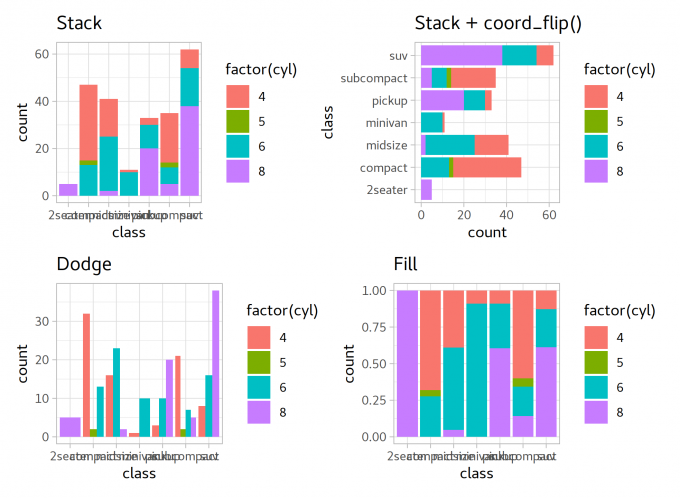
library(patchwork)
p1 <- ggplot(mpg,aes(x=class)) +
geom_bar(aes(fill=factor(cyl)),position="stack")+
ggtitle(label='Stack')+ # position = stack (default)
theme_light()
p2 <- ggplot(mpg,aes(x=class)) +
geom_bar(aes(fill=factor(cyl)),position="stack")+
ggtitle(label='Stack + coord_flip()') + coord_flip()+ # Switch axis
theme_light()
p3 <- ggplot(mpg,aes(x=class)) +
geom_bar(aes(fill=factor(cyl)),position="dodge")+
ggtitle(label='Dodge')+ # 并排放置
theme_light()
p4 <- ggplot(mpg,aes(x=class)) +
geom_bar(aes(fill=factor(cyl)),position="fill")+
ggtitle(label='Fill')+ # 填充显示比例
theme_light()

(p1|p2)/(p3|p4)
ggsave("bar4.png", w=6.56, h=4.8)

aQQ10O.md.png

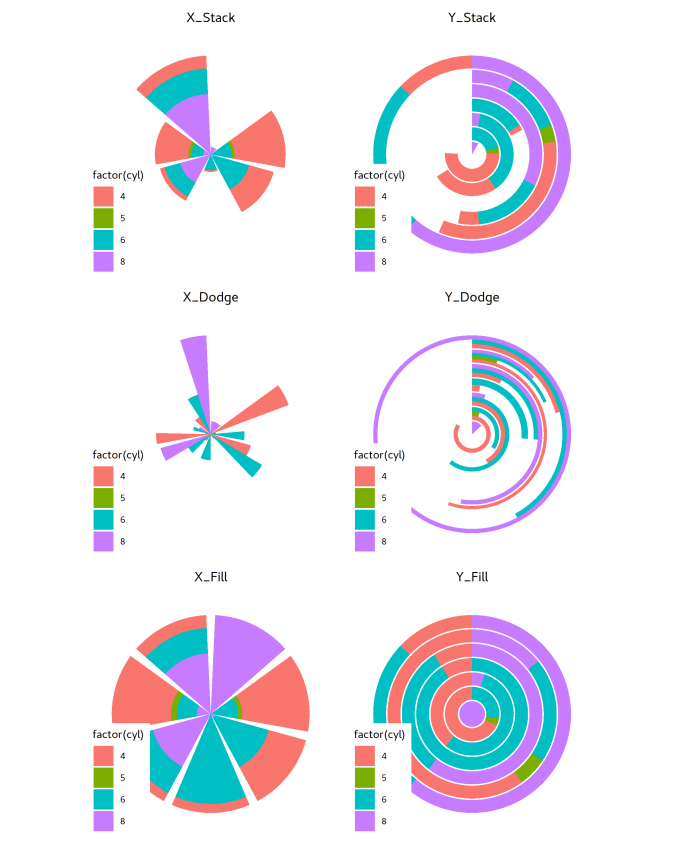
polar axis

library(ggthemes)

p1 <- ggplot(mpg,aes(x=class)) +
geom_bar(aes(fill=factor(cyl)),position="stack")+
ggtitle(label='X_Stack') + coord_polar('x') + theme_map()+
theme(plot.title = element_text(hjust = 0.5))

p2 <- ggplot(mpg,aes(x=class)) +
geom_bar(aes(fill=factor(cyl)),position="dodge")+
ggtitle(label='X_Dodge') + coord_polar('x') + theme_map()+
theme(plot.title = element_text(hjust = 0.5))

p3 <- ggplot(mpg,aes(x=class)) +
geom_bar(aes(fill=factor(cyl)),position="fill")+
ggtitle(label='X_Fill') + coord_polar('x') + theme_map()+
theme(plot.title = element_text(hjust = 0.5))

p11 <- ggplot(mpg,aes(x=class)) +
geom_bar(aes(fill=factor(cyl)),position="stack")+
ggtitle(label='Y_Stack') + coord_polar('y') + theme_map()+
theme(plot.title = element_text(hjust = 0.5))

p22 <- ggplot(mpg,aes(x=class)) +
geom_bar(aes(fill=factor(cyl)),position="dodge")+
ggtitle(label='Y_Dodge') + coord_polar('y') + theme_map()+
theme(plot.title = element_text(hjust = 0.5))

p33 <- ggplot(mpg,aes(x=class)) +
geom_bar(aes(fill=factor(cyl)),position="fill")+
ggtitle(label='Y_Fill') + coord_polar('y') + theme_map()+
theme(plot.title = element_text(hjust = 0.5))

(p1|p11)/(p2|p22)/(p3|p33)
ggsave("bar_fan.png", w=7.51, h=9.42 )

aQQvDK.md.png

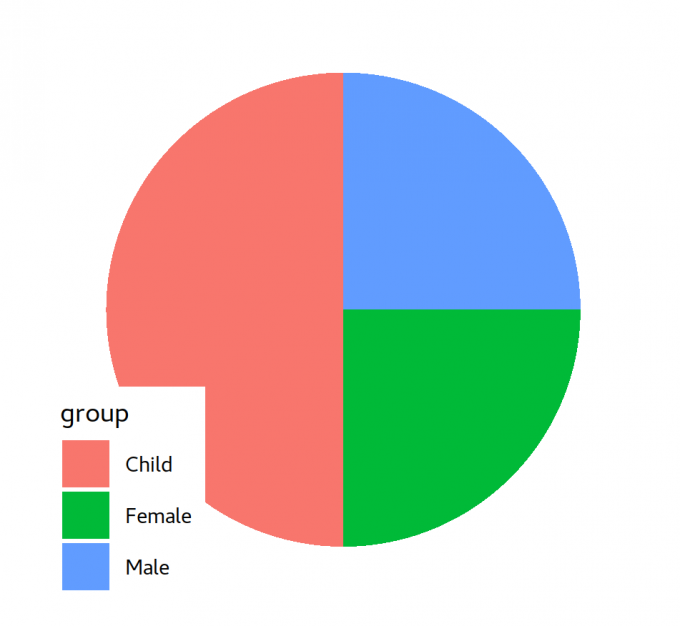
Pie plot

Codes: Blog/语雀

More

dismiss value when it equals zero
reverse the fectors in a second
Author

Karobben

Posted on

2021-01-16

Updated on

2024-01-11

Licensed under

Comments