Install
Install from GitHub: const-ae/ggupset
Quick start
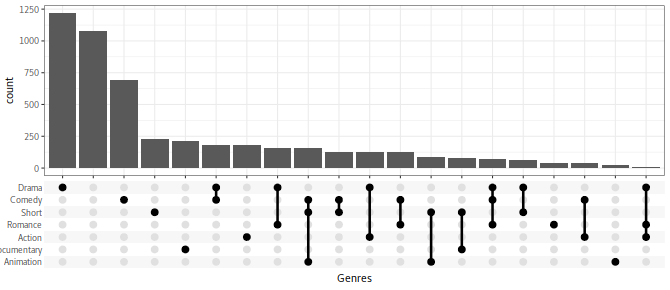
The result shown above.
library(ggplot2) library(tidyverse, warn.conflicts = FALSE) library(ggupset)
head(tidy_movies)
png('123.png',w=670,h=290) tidy_movies %>% distinct(title, year, length, .keep_all=TRUE) %>% ggplot(aes(x=Genres)) + geom_bar() + scale_x_upset(n_intersections = 20)+ theme_bw() dev.off()
|
Expression Matrix
GeneID |
Intestine BSFL10 |
Intestine BSFL20 |
Intestine BSFL30 |
gene-COX1 |
0.1461 |
0.0000 |
0.0492 |
gene-LOC117245643 |
12.3222 |
11.6741 |
10.6068 |
gene-LOC117245646 |
0.0000 |
0.0000 |
0.0292 |
gene-LOC117245648 |
0.1160 |
0.0439 |
0.0521 |
gene-LOC117245649 |
0.0000 |
0.0000 |
0.0000 |
gene-LOC117245651 |
0.8456 |
0.8828 |
0.5239 |
Conversion Function
Convert_up <- function(TB){ TB_tmp = TB for(i in colnames(TB)){ TB_tmp[i] = i } TB_tmp[TB == 0] = "" TB_t <- data.frame(t(TB_tmp), stringsAsFactors = F) TB_tmp$upset = as.list(TB_t) return(TB_tmp) }
|
Expression <- read.table("../allSample.expr.csv", header = T)
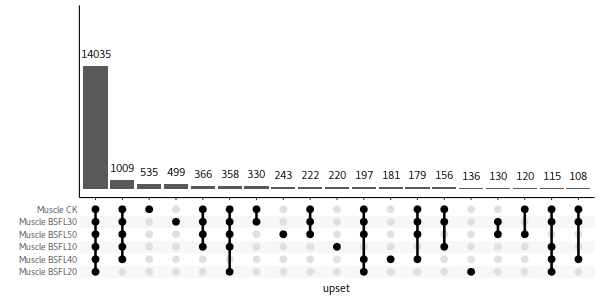
TMP <- Convert_up(Expression[,-1]) ggplot(data= TMP, aes(x=upset)) + geom_bar() + geom_text(stat='count', aes(label=after_stat(count)), vjust=-1) + scale_x_upset(n_intersections = 20) + scale_y_continuous(breaks = NULL, name = "") + expand_limits(y=c(0,20000)) + theme(panel.background = element_blank(), axis.line = element_line())
|