Principles of Biochemistry 18 |Regulation of glycolysis in liver cells| Class Notes |HarvardX
Allosteric Enzyme
It is a class of regulated with distinct regulatory and catalytic subunit.
Aspartate Transcarbamoylase (ATCase)
- Catalyzes the first step of the biosynthesis of pyrimidine
$Carbamoyl\ phosphate + Aspartate \overset{ATCase}{\rightleftharpoons}$
$N^ {_ -} carbamoylaspartate + pi \to … \to CTP$ - CTP: Cytidine Triphosphate
- In the experiment, CTP$\uparrow$ cause the ATCase activity$\downarrow$
- CTP has no chemical similar structure to the substrates of ATCase
- CTP does not interact with ATCase
The experiment of Distance migration
-
When ATCase separated on the sucrose gradient
- purified as a single peak
- can both bind with CTP and substrates and inhibited by CTP
-
When pretreated ATCase separated on the sucrose gradient
- two peaks.
- One can only bind the CTP
- Another can only bind the substrates
That means ATCase contains two types of subunits:
- Regulatory subunit: bind CTP
- Catalytic subunit: bind substrates
This is what the Allosteric Enzyme which has a catalytic site distinct from the regulatory site.
Terminology
Allos = other
ster = structure
subunits of ATCase
It has six subunits organized into three dimers, six regulatory subunits that are organized into three dimers.
When binding with the substrate (asperate), it changes conformation from T to R state.
- T: Inactive state, predominant without substrates
- R: activate, stabilized by substrate binding
Homotropic allosteric behavior
homotropic regulation:
Example:
Set the ATCase with two substrates:
- Carbamoyl phosphate: constant concentration.
- Aspartate: increasing concentration
Result: it is a sigmoidal curve (S shape).
Example2:
The same condition as above but only with the catalytic subunit of ATcase:
We obtain a hyperbolic curve which looks like a curve that we would get with a Michaelian enzyme.
Hypothesis:
- The Allosteric protein are oligomeric (made of several subunits in a symmetrical fashion)
- Each subunit contains only one binding site for any given ligand.
- The enzyme can exist in at least 2 states (such as T and R)
Another model: KNF model
KNF model assumes a sequential progression from T to R.
- Single T conformation: No ligand bound to the enzyme.
- Conformation Changed: One ligand binds to one subunit
- Conformation change transmitted to the neighboring vacant subunit
Enzyme-limited reaction
- Substrate-limited reaction:
- The speed of the reaction decided by the supply of the substrate
- Enzyme-limited reaction:
- The activity of the enzyme is low
untile the enzyme was activated by some specific effector
- The activity of the enzyme is low
What is the Enzyme-limited reaction
$Fructose-6P +ATP \overset{PFK-1}{\longrightarrow} Fructose-1,6-P + ADP$
Phosphofructokinase-1 (PFK-1)
$$
\frac{[Fructose-1,6-P][ADP]}{[Fructose-6-P][ATP]} = R_ f
$$
| Vivo | Vitro | |
|---|---|---|
| Rf | 0.04 | 250 |
The ratio difference between Vivo and Vitro indicates that the PFK-1 was in a real low activity under normal conditions.
Regulations
Allosteric regulation:
- Allosteric regulators usually reflect cell metabolic state
- Fasta regulation (a few milliseconds)
Reversible convalent modification:
- IE-phosphorylation
- Slower than allosteric (a few seconds)
Transcriptional regulation
- The slowest form of regulation
PFK-1 regulation
ATP
ATP is an inhibitor of the PFK-1
Low [ATP]: The curve of PFK-1 is hyperbolic:
- A very low concentration of PFK-1 could have a high level of activity.
High [ATP]: The curve of PFK-1 is sigmoidal:
- The activities of PFK-1 are low until its concentration is higher than a specific level.
Physiological significance: PFK-1 is not needed when the ATP is sufficient.
AMP
AMP is an activator of the PFK-1.
As a result, the ratio of ATP and AMP could regulate the activity of the PFK-1.
$\frac{[ATP]}{[AMP]}$ is high:
- High energy state
- ATP is abundant
- PFK-1’s activity is suppressed.
$\frac{[ATP]}{[AMP]}$ is low:
- Low energy state
- ATP is a deficiency
- PFK-1’s activity is increased.
Why not ADP
ADP is a poor indicator of the cell energy state indicator.
Because:
$$
2 ADP \overset{Adenylate \ kinase}{\longrightarrow} ATP + AMP
$$
On the other hand, the AMP is more sensible to the ADP.
concentration: $[AMP] < [ADP] < [ATP]$
changing scale: $AMP > ADP > ATP$ (sensitivity)
others
Citrate inhibited PFK-1 by enhancing the ATP inhibitor effect.
PFK-2
$$
fructose-6-bisphosphate +ATP \overset{PFK-2}{\longrightarrow} fructose-2,6-bisphosphate + ADP
$$
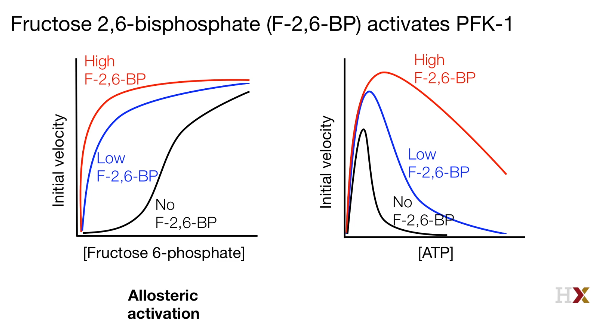
In the liver, the ATP is always high, the fructose-2,6-biphosphate played the role of ATP.
The fructose-2,6-bisphosphate dampened the effect of ATP on PFK-1.
 |
|---|
| © HarvardX |
PFK-2 contains:
- kinase domain: phosphorylation of the substrates
- phosphate domain: dephosphorylation the produces
The function of the two domain was regulated by other factors and indirectly control the activity of PFK-1
PFK-2 in liver
PFK-2 is regulated by the [Glu]Blood.
We know that: $[Glu]_ {Blood} \approx [Glu]_ {Liver} $
-
When [GluBlood] is high, Glu stats to be metabolized,
As a result, a feed-forward stimulation occurs:- $\uparrow[F-6-P] \to \ \uparrow PFK-2 \to \ \uparrow[F-2,6-P] \uparrow Glycolysis$
-
When [GluBlood] is low, Glu stats to be metabolized,
- $\uparrow FBPase$ activity
- $\downarrow F-2,6-BP$
- $\downarrow PFK-1$ activity
- Glucagon -> Gs -> convert ATP to cAMP -> PKA -> PFK-2(phosphate and inhibitate) -> PFK-1 decrease
Liver
When The [Glu]Blood is high: [ATP] is high, too:
Muscle:
- Hexokinase was prohibited (by G-6-P)
- activity of PFK-1 $\downarrow$ (by ATP)
- Glu was taken by the liver and be converted into Glycogen and fat.
Liver:
- Glucokinase:
- Not inhibited by glucose-6-P
- High Km
- Activities of Glycolysis $\downarrow$ (by ATP)
- Glycogen and fatty acid synthesis are activated.
Principles of Biochemistry 18 |Regulation of glycolysis in liver cells| Class Notes |HarvardX
https://karobben.github.io/2021/05/14/LearnNotes/edx-biochm-18/


