Cell-programmed nutrient partitioning in the tumour microenvironment.
Cell-programmed nutrient partitioning in the tumour microenvironment.
Cite: Reinfeld, Bradley I., et al. “Cell-programmed nutrient partitioning in the tumour microenvironment.” Nature 593.7858 (2021): 282-288.
Abstract
PET could use for toumor image.
Cacncer Cell Marker: Glucose intacke; Lactate generated (Warburg metabolism)
So as the umour-infltrating immune cells.
As a result, the immune cell was restricted and evaluated.
Thesis: immune cells dysregulated: cell-intrinsic programs or by competition?
Our Solution:
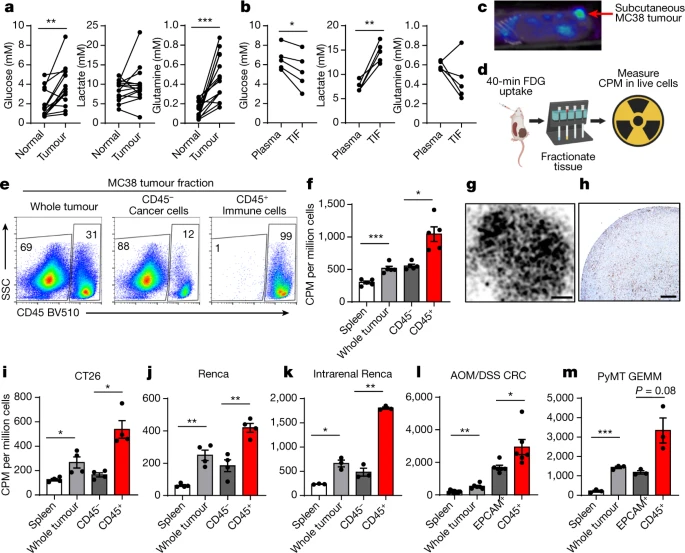
- PET: tracers to measure the access to and uptake of glucose and glutamine
Result:
- Intratumoral glucose:
- myeloid cells > T cells > Cancer cells
- cancer cells
- Cancer Cell > all other cells
Hypothesis:
- Metabolism in Result was:
- Programmed in cell-intrinsic manner through mTORC1 and related genes.
Variation:
- tumour-resident cell: glutamine↓ → glucose↑
- glutamine metabolism → glucose uptake↑
Conclusion: cell-intrinsic programs drive the preferential acquisition of glucose and glutamine by immune and cancer cells, respectively.
Cell-selective partitioning of these nutrients could be exploited to develop therapies and imaging strategies to enhance or monitor the metabolic programs and activities of specifc cell populations in the TME.
Intro
Cancer cell; Rapidly proliferating cell, and activated immune cells: convert glucose to lactate very quickly.
FDG PET imaging to detect cancer
Resutl

| Figures | Illustration |
|---|---|
| A, B | |
| C, D | |
| E | |
| F | |
| G, H | |
| I, J | |
| K | |
| I |

Myeloid cells take up the most glucose
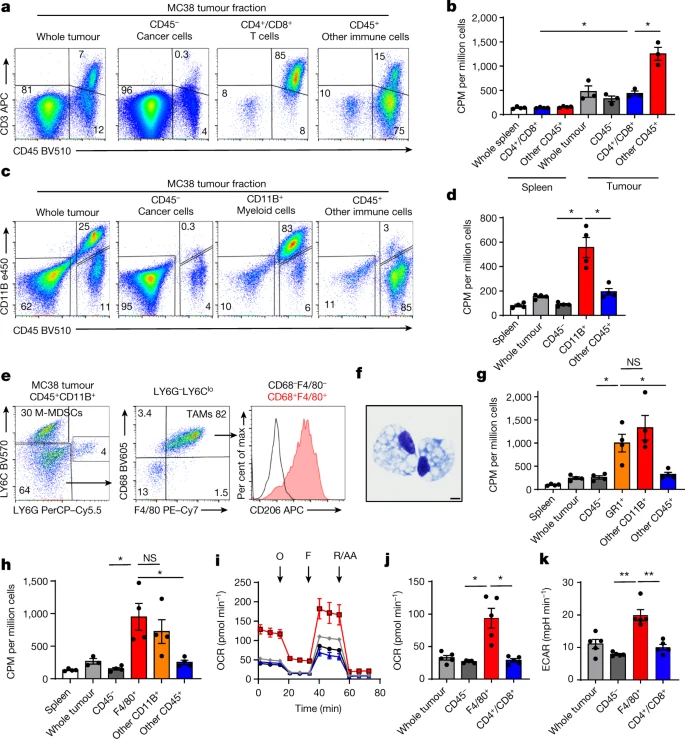
| Figures | Illustration |
|---|---|
| A, B | |
| C, D | |
| E | |
| F | |
| G, H | |
| I-K | |
| cell in the TME and maintain robust glucose metabolism. |

mTORC1 programs metabolism in the TME
mTORC1: supports anabolic metabolism and nutrient uptake
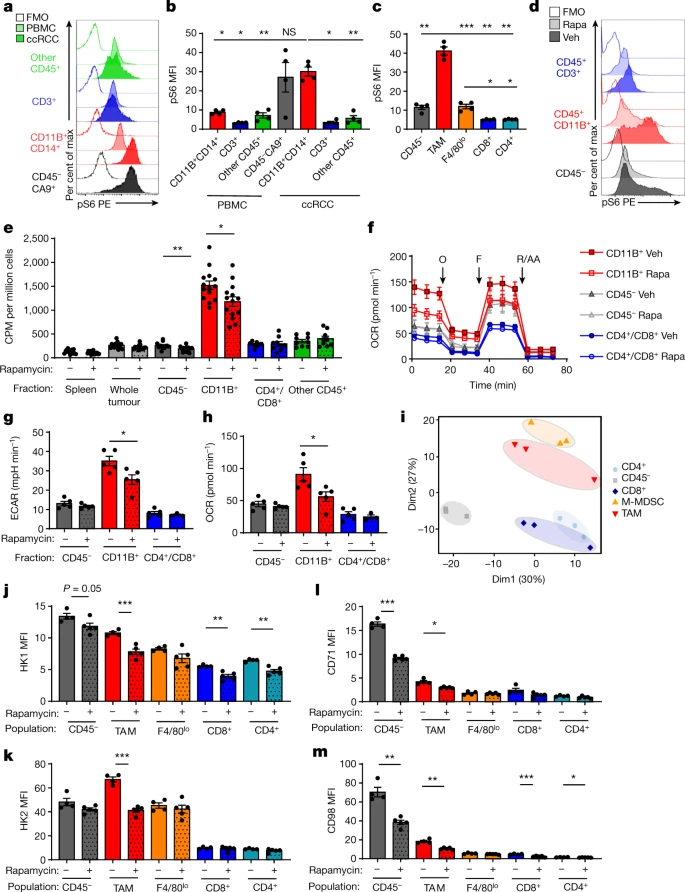
pS6: monitor the mTORC1 pathway activity in tumour myeloid cells
CD11B+ myeloid cells
Cell type:
-
Other CD45⁺ Cell: T cell CD45+ c :: To characterize the non-T cell CD45⁺ cells, myeloid CD11B⁺ (microbeads).
-
CD3⁺: CD3⁺ T cells
-
CD4⁺: CD4⁺ T cells)
-
CD8⁺: CD8⁺ T cells
-
CD11B⁺/CD45⁺: Myeloid:
-
CD14; CA9
The hypothesis is mTORC1 which supports anabolic metabolism and nutrient uptake. pS6 is a protein which under the upstream of the mTOR signal pathway. Rapamycin can suppress the pS6 without affect the tumor’s weight, concentrations of glucose, glutamine; lactate in the TME; but led to significant decreases in pS6 levels, T cell infiltration, Ki67 levels in cancer cells and T cells, and the cell size of TAMs (Fig. 3d). Treatment with rapamycin also resulted in significant decreases in FDG uptake in myeloid and cancer cells.
f, g, h show that Rapa led to a in myeloid cell metabolism ex vivo, whereas cancer cells and T cells remained unchanged
decrease in myeloid cell metabolism
ex vivo, whereas cancer cells and T cells remained unchanged
Hk1 was broadly expresse, Hk2, the hexokinase isoforms 2, rate-limiting step of glycolysis was highly expressed in myeloid cells.
iron transporter CD71 and the amino acid transporter CD98
This has implications for metabolism-directed agents as
well as therapies that target myeloid cells, with the potential to either enhance or impair tumour-related inflammation. TME-resident cells have the capacity to increase glucose uptake like upreguate the mTOR singal pathway.
Veh? : spleen vehicle; rapamycin- and the vehicle-treated samples; 8 mice for CD4+/CD8+ vehicle; glutamine plasma and TIF vehicle(5% Tween‐80, 5% PEG‐40??),
| Figures | Illustration |
|---|---|
| A | |
| B | |
| C | |
| D | |
| E | |
| F - H | |
| I | |
| J, K | |
| L, M |
Cell-programmed nutrient partitioning in the tumour microenvironment.
https://karobben.github.io/2021/10/07/LearnNotes/paper-cancer-mi/


