Python: Data Calculating Skills
2D points cloud
Distance of two points
delftstack
math.dist()from scipy.spatial import distance a = (1 , 2 , 3 ) b = (4 , 5 , 6 ) print(distance.euclidean(a, b))
Longest distance of points in a point cloud
The longest distance of points between any two points.
Yann, 2015
from numpy import random, nanmax, argmax, unravel_indexfrom scipy.spatial.distance import pdist, squareform A = random.randint(-5 ,5 , (500 ,2 )) D = pdist(A) D = squareform(D); N, [I_row, I_col] = nanmax(D), unravel_index( argmax(D), D.shape ) A[I_row] A[I_col]
Nearest adjacent point
import numpy as npimport math p1 = [1 ,2 ] p_list = [[2 ,1 ], [1 ,2 ], [0 ,0 ]] p_list[np.array([math.dist(p1, i) for i in p_list]).argmin()]
Distance from points to line
© DotPi, 2016
point p3 to line p1-p2
from numpy.linalg import norm p1=(x1,y1) p2=(x2,y2) p3=(x3,y3) d = norm(np.cross(p2-p1, p1-p3))/norm(p2-p1)
Distance from points to rectangle
p1----p2
| p5 |
| |
p4----p3
from point p5 to rectangle p1,p2,p3,p4
from numpy.linalg import normdef lin_dist (p1, p2, p3 ): d = norm(np.cross(p2-p1, p1-p3))/norm(p2-p1) return ddef p_rect (p1,p2,p3,p4,p5 ): d1 = lin_dist(p1,p2,p5) d2 = lin_dist(p1,p4,p5) d3 = lin_dist(p3,p2,p5) d4 = lin_dist(p3,p4,p5) return min ([d1,d2,d3,d4]) p1=(x1,y1) p2=(x2,y2) p3=(x3,y3) p4=(x4,y4) p5=(x5,y5) p_rect(p1,p2,p3,p4,p5)
Points rotation
© an0nym0use; 2020
P1 and P2 are points in points. Rotate the P1 to the same level as P2, so as the rest of others.
import numpy as npdef rotate (point, origin, degrees ): radians = np.deg2rad(degrees) x,y = point offset_x, offset_y = origin adjusted_x = (x - offset_x) adjusted_y = (y - offset_y) cos_rad = np.cos(radians) sin_rad = np.sin(radians) qx = offset_x + cos_rad * adjusted_x + sin_rad * adjusted_y qy = offset_y + -sin_rad * adjusted_x + cos_rad * adjusted_y return qx, qy
Angles of two points
This codes works perfect to me.
© sabbahillel; 2017
import math myradians = math.atan2(targetY-gunY, targetX-gunX) mydegrees = math.degrees(myradians) myradians = math.radians(mydegrees)def point2agl (P1, P2 ): myradians = math.atan2(P1[1 ]-P2[1 ], P1[0 ]-P2[0 ]) mydegrees = math.degrees(myradians) return mydegrees
Angle of three points
© Manivannan Murugavel
import mathdef getAngle (a, b, c ): ang = math.degrees(math.atan2(c[1 ]-b[1 ], c[0 ]-b[0 ]) - math.atan2(a[1 ]-b[1 ], a[0 ]-b[0 ])) return return ang - 360 if ang >= 360 else ang print(getAngle((5 , 0 ), (0 , 0 ), (0 , 5 )))
Angle of two vectors
© adamsmith.haus
import numpy as npimport math vector_1 = [0 , 1 ] vector_2 = [1 , 0 ]def Vector_angle (vector_1, vector_2 ): unit_vector_1 = vector_1 / np.linalg.norm(vector_1) unit_vector_2 = vector_2 / np.linalg.norm(vector_2) dot_product = np.dot(unit_vector_1, unit_vector_2) angle = np.arccos(dot_product) mydegrees = math.degrees(angle) return mydegrees ang = Vector_angle(vector_1, vector_2) print(ang)
SO, we can have angle of 4 points:
P1 = np.array([0 ,1 ]) P2 = np.array([1 ,1 ]) P3 = np.array([1 ,2 ]) P4 = np.array([3 ,1 ]) vector_1 = P2 - P1 vector_2 = P3 - P2 ang = Vector_angle(vector_1, vector_2) print(ang)def Points4_angle (P1, P2, P3, P4 ): P1 = np.array(P1) P2 = np.array(P2) P3 = np.array(P3) P4 = np.array(P4) vector_1 = P2 - P1 vector_2 = P4 - P3 unit_vector_1 = vector_1 / np.linalg.norm(vector_1) unit_vector_2 = vector_2 / np.linalg.norm(vector_2) dot_product = np.dot(unit_vector_1, unit_vector_2) angle = np.arccos(dot_product) mydegrees = math.degrees(angle) return mydegrees
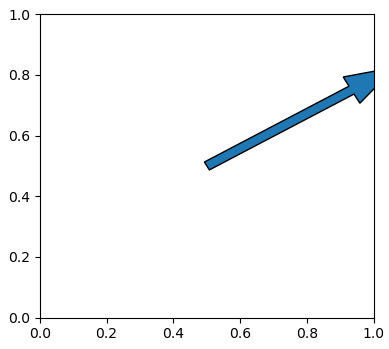
Find the end point by angele and length
import mathimport matplotlib.pyplot as plt Angle = 30 Radian = 0.5 Origin = (0.5 , 0.5 ) End_x = math.cos(math.radians(Angle)) * Radian End_y = math.sin(math.radians(Angle)) * Radian plt.arrow(Origin[0 ], Origin[0 ], End_x, End_y, head_width = 0.1 , width = 0.03 ) plt.show()
Test
import cv2import pandas as pdimport numpy as npimport matplotlib.pyplot as pltimport seaborn as sns NP_result = np.load("/mnt/8A26661926660713/Deng/Cell_segmentation/CellSegmentation/Results/220214_all_channels/images/lgl.3d.casp.1.lsm2_seg.npy" , allow_pickle=True ) A = NP_result.all ()['masks' ] index = pd.MultiIndex.from_product( (*map (range , A.shape[:2 ]), (['r' ])), names=('col' ,'row' , None ) ) df = pd.Series(A.flatten(), index=index) df = df.unstack() df = df.reset_index().reindex(columns=['row' , 'col' , 'r' ]) sns.scatterplot(data=df[df.r!=0 ], x= "row" , y="col" , hue = "r" ) plt.show()
Second to format Hour and min
studytonight.com
seconds = 12601 seconds = seconds % (24 * 3600 ) hour = seconds // 3600 seconds %= 3600 minutes = seconds // 60 seconds %= 60 print("%d:%02d:%02d" % (hour, minutes, seconds))
3:30:01