import numpy as np
import matplotlib.pyplot as plt
class Brownian():
"""
A Brownian motion class constructor
"""
def __init__(self,x0=0):
"""
Init class
"""
assert (type(x0)==float or type(x0)==int or x0 is None), "Expect a float or None for the initial value"
self.x0 = float(x0)
def gen_random_walk(self,n_step=100):
"""
Generate motion by random walk
Arguments:
n_step: Number of steps
Returns:
A NumPy array with `n_steps` points
"""
if n_step < 30:
print("WARNING! The number of steps is small. It may not generate a good stochastic process sequence!")
w = np.ones(n_step)*self.x0
for i in range(1,n_step):
yi = np.random.choice([1,-1])
w[i] = w[i-1]+(yi/np.sqrt(n_step))
return w
def gen_normal(self,n_step=100):
"""
Generate motion by drawing from the Normal distribution
Arguments:
n_step: Number of steps
Returns:
A NumPy array with `n_steps` points
"""
if n_step < 30:
print("WARNING! The number of steps is small. It may not generate a good stochastic process sequence!")
w = np.ones(n_step)*self.x0
for i in range(1,n_step):
yi = np.random.normal()
w[i] = w[i-1]+(yi/np.sqrt(n_step))
return w
def stock_price(
self,
s0=100,
mu=0.2,
sigma=0.68,
deltaT=52,
dt=0.1
):
"""
Models a stock price S(t) using the Weiner process W(t) as
`S(t) = S(0).exp{(mu-(sigma^2/2).t)+sigma.W(t)}`
Arguments:
s0: Iniital stock price, default 100
mu: 'Drift' of the stock (upwards or downwards), default 1
sigma: 'Volatility' of the stock, default 1
deltaT: The time period for which the future prices are computed, default 52 (as in 52 weeks)
dt (optional): The granularity of the time-period, default 0.1
Returns:
s: A NumPy array with the simulated stock prices over the time-period deltaT
"""
n_step = int(deltaT/dt)
time_vector = np.linspace(0,deltaT,num=n_step)
stock_var = (mu-(sigma**2/2))*time_vector
self.x0=0
weiner_process = sigma*self.gen_normal(n_step)
s = s0*(np.exp(stock_var+weiner_process))
return s
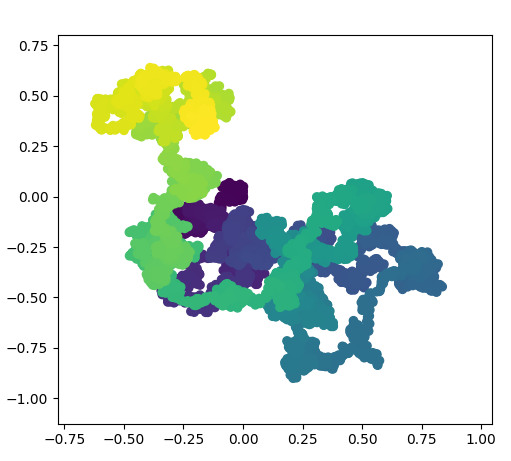
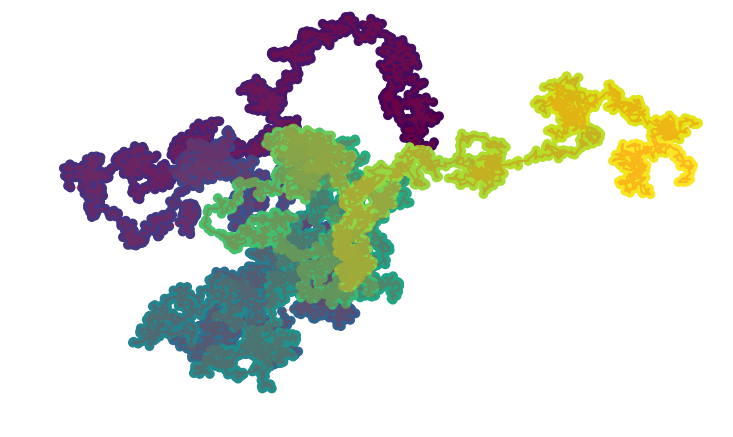
b1 = Brownian()
b2 = Brownian()
x = b1.gen_normal(10000)
y = b2.gen_normal(10000)
colors = np.linspace(0, 1, len(x))
plt.plot(x,y, color = 'grey')
plt.scatter(x,y, c=colors, cmap='viridis')
xmax,xmin,ymax,ymin = x.max(),x.min(),y.max(),y.min()
scale_factor = 1.25
xmax,xmin,ymax,ymin = xmax*scale_factor,xmin*scale_factor,ymax*scale_factor,ymin*scale_factor
plt.xlim(xmin,xmax)
plt.ylim(ymin,ymax)
plt.show()
|

 © Karobben