R-riverplot

R-riverplot

R-riverplot

install.packages("riverplot")
library(riverplot)

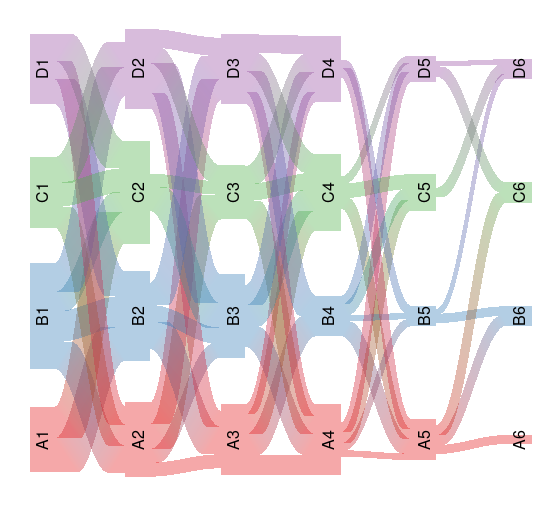
##1. 画一个6级能量流动图/桑基图

构造连接节点(边)的数据框,采用runif生成模拟数据

实验中每个节点间的连续情况是己知的

#1. 生成一个组1-5与组2-6对应的值数据框:
edges = data.frame(N1 = paste0(rep(LETTERS[1:4], each = 4),
rep(1:5, each = 16)),
N2 = paste0(rep(LETTERS[1:4], 4), rep(2:6, each = 16)),
Value = runif(80, min = 2, max = 5) * rep(c(1, 0.8, 0.6, 0.4, 0.3),
each = 16),
stringsAsFactors = F)
# 2. 筛选80%的记录,以免每个点都对应到4个点(可选)
edges = edges[sample(c(TRUE, FALSE), nrow(edges), replace = TRUE, prob = c(0.8, 0.2)),]
head(edges)
  N1 N2    Value
1 A1 A2 3.308538
2 A1 B2 4.642646
3 A1 C2 4.339417
5 B1 A2 3.413252
6 B1 B2 3.028736
7 B1 C2 2.722511
# 3. 获得非冗余结点nodes
nodes = data.frame(ID = unique(c(edges$N1, edges$N2)), stringsAsFactors = FALSE)
## 添加x: X为组编号,即列位置
nodes$x = as.integer(substr(nodes$ID, 2, 2))
## Y为组类型字符,转换为ASCII编号,减65,即为A/B/C/D转换为0/1/2/3数值,即行位置
nodes$y = as.integer(sapply(substr(nodes$ID, 1, 1), charToRaw)) - 65
rownames(nodes) = nodes$ID
head(nodes)

## 添加颜色
library(RColorBrewer)
## brewer.pal生成柔合色,后面加调淡颜色
palette = paste0(brewer.pal(4, "Set1"), "60")
## 对每个节点生成相应的列表格式,颜色col,线条类型lty,文字颜色textcol
styles = lapply(nodes$y, function(n) {
list(col = palette[n+1], lty = 0, textcol = "black")
})
names(styles) = nodes$ID
## 将点、单和样式合并为List,构建riverplot对象
rp <- list(nodes = nodes, edges = edges, styles = styles)
## 添加对你属性包括riverplot
class(rp) <- c(class(rp), "riverplot")

plot(rp, plot_area = 0.95, yscale=0.06)

Riverplot for change of the Genes

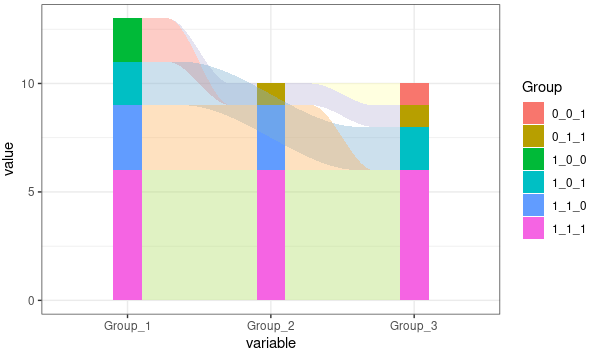
  1. Quick Build A Sankey Diagram from Different list

Let’s say, we have 3 group of data:

  • Group A: A-M
  • Group B: A-N; But G-J is missing
  • Group C: A-N; But I-Ois missing
A <- c("A", "B", "C", "D", "E", "F", "G", "H", "I", "J", "K", "L", "M")
B <- c("A", "B", "C", "D", "E", "F", "K", "L", "M", "N")
C <- c("A", "B", "C", "D", "E", "F", "G", "H", "N","O")

TB = data.frame(row.names = sort(unique(c(A,B,C))))

Num = 0
for(Col in list(A,B,C)){
Num = Num + 1
TB[paste("Group",Num, sep="_")] = 0
TB[paste("Group",Num, sep="_")][row.names(TB) %in% Col,] = 1
}

print(TB)
Group_1 Group_2 Group_3
A       1       1       1
B       1       1       1
C       1       1       1
D       1       1       1
E       1       1       1
F       1       1       1
G       1       0       1
H       1       0       1
I       1       0       0
J       1       0       0
K       1       1       0
L       1       1       0
M       1       1       0
N       0       1       1
O       0       0       1
  1. Plot Function
library(stringr)
library(ggplot2)
library(reshape2)
library(RColorBrewer)

Kaboom_Flow <- function(TB){

coul = brewer.pal(12, "Set3")
# Melt data
Group = c()
for(i in c(1:nrow(TB))){
Group= c(Group, paste(TB[i,],collapse = "_"))
}
Group_TB_gene = data.frame(Group,row.names = row.names(TB))

Group = as.data.frame(table(Group))
Group = Group[order(Group$Group, decreasing = F),]

Group_N = data.frame(str_split_fixed(Group[[1]], "_", ncol(TB)), stringsAsFactors =F)
for(i in c(1:ncol(Group_N))){
Group_N[[i]] = as.numeric(Group_N[[i]])
}

Group_N <- Group_N * Group$Freq
colnames(Group_N) = colnames(TB)


Increasing_list = Group_N
for(i in c((nrow(Increasing_list)-1):1)) {
Increasing_list[i,] = Increasing_list[i+1,] + Increasing_list[i,]
}
Increasing_TB <- rbind(Increasing_list, rep(0, ncol(Increasing_list),))

Group_N$Group <- Group$Group

Group_TB <- melt(Group_N)


Mutation_flow<- function(TB, Bar_w= 0.2){
P <- ggplot() +
geom_bar(data=Group_TB, aes(x=variable, y=value, fill = Group), stat = 'identity', position = 'stack', width = Bar_w) + theme_bw()

return(P)
}

Connect <- function(TMP_TB, Bar_w = 0.2, C_alp = .1, Color="grey"){
Indent_ = Bar_w/2
#C_alp = (1-Bar_w) * C_alp + Indent_
C_alp = (max(TMP_TB$X)- min(TMP_TB$X) -Bar_w) * C_alp + Indent_
TMP_TB2 <- TMP_TB
TMP_TB3 <- TMP_TB
TMP_TB2$X <- TMP_TB2$X + Indent_
TMP_TB3$X <- TMP_TB3$X - Indent_
TMP_ind <- rbind(TMP_TB2, TMP_TB3)
TMP_ind <- TMP_ind[which(TMP_ind$X %in% c(max(TMP_ind$X), min(TMP_ind$X))==FALSE),]
TMP_TB2$X <- TMP_TB2$X + C_alp
TMP_TB3$X <- TMP_TB3$X - C_alp
TMP_alp <- rbind(TMP_TB2, TMP_TB3)
TMP_alp <- TMP_alp[which(TMP_alp$X %in% c(max(TMP_alp$X), min(TMP_alp$X))==FALSE),]
Area_TB = rbind(TMP_ind, TMP_alp)
g1 <- ggplot() +
geom_smooth(data=Area_TB[Area_TB$line=="UP",], aes(x=X, y = value))+
geom_smooth(data=Area_TB[Area_TB$line=="DOWN",], aes(x=X, y = value))

# build plot object for rendering
gg1 <- ggplot_build(g1)
# extract data for the loess lines from the 'data' slot
df2 <- data.frame(x = gg1$data[[1]]$x,
ymin = gg1$data[[1]]$y,
ymax = gg1$data[[2]]$y)

# use the loess data to add the 'ribbon' to plot
p <- geom_ribbon(data = df2, aes(x = x, ymin = ymin, ymax = ymax),
fill = Color, alpha = 0.4)
return(p)
}

# Get the Index

Index_ = c()
for(Row in c(1:nrow(Group_N))){
TMP <- Group_N[Row,1:(ncol(Group_N)-1)]
# clean the duplicate 0
# remove 0
Result = TMP[which(TMP!=0)]
# Chech of the end
tmp_id = which(colnames(TMP)==colnames(Result)[ncol(Result)])
if(tmp_id != ncol(TMP)){
Result[colnames(TMP)[tmp_id+1]] = 0
}
# Chech of the head
tmp_id = which(colnames(TMP)==colnames(Result)[1])
if(tmp_id != 1){
Result[colnames(TMP)[tmp_id-1]] = 0
}
# sort by raw data
Result = Result[as.character(sort(factor(colnames(Result),
levels = colnames(TMP))))]
row.names(Result) = Row
Index_ = c(Index_, list(Result))
}

P <- Mutation_flow(TB)
for(i in c(1:length(Index_))){
TMP = Index_[[i]]
Row = as.numeric(rownames(TMP))
TMP = Increasing_TB[Row:(Row+1),colnames(TMP)]
TMP$line=c("UP","DOWN")
for(col_i in c(1:(ncol(TMP)-2))){
TMP_TB = melt(TMP[c(col_i,col_i+1, ncol(TMP))])
TMP_TB$X = as.numeric(factor(TMP_TB$variable , levels=colnames(Increasing_TB
)))
P <- P + Connect(TMP_TB,.2, .1, coul[1+(i%%12)])
}
}
print(P)
return(list(P,Group_TB_gene))
}

Reference

Packaged function

remotes::install_github("karobben/ggkaboom")
library(ggkaboom)

Kaboom_flow(TB)

Author

Karobben

Posted on

2020-01-22

Updated on

2024-01-11

Licensed under

Comments