library(clusterProfiler)
library(org.Dm.eg.db)
library(pathview)
library(reshape2)
library(stringr)
library(ggplot2)
library(enrichplot)
args = commandArgs(trailingOnly=TRUE)
SampleA= args[1]
SampleB= args[2]
Pvalue = 0.01
logFC= 2
C_cut = 10
Level= 2
Sample_Dir = paste(SampleA,"_VS_",SampleB,"/",sep="")
for(i in c("GO", "KEGG", "WIKI", "Reactome")){
dir.create(i)
dir.create(paste(i, Sample_Dir,sep='/'))
}
Gene_list <- read.table(paste("RSEM_transcript/transcript.isoform.counts.matrix.", SampleA, "_vs_", SampleB,".edgeR.DE_results", sep=""))
ENTREZID = bitr(row.names(Gene_list), fromType="FLYBASE", toType="ENTREZID", OrgDb="org.Dm.eg.db")
FLYBASECG = bitr(row.names(Gene_list), fromType="FLYBASE", toType="FLYBASECG", OrgDb="org.Dm.eg.db")
SYMBOL = bitr(row.names(Gene_list), fromType="FLYBASE", toType="SYMBOL", OrgDb="org.Dm.eg.db")
Gene_list$ENTREZID <- ENTREZID$ENTREZID[match(row.names(Gene_list), ENTREZID$FLYBASE)]
Gene_list$FLYBASECG <- FLYBASECG$FLYBASECG[match(row.names(Gene_list), FLYBASECG$FLYBASE)]
Gene_list$SYMBOL <- SYMBOL$SYMBOL[match(row.names(Gene_list), SYMBOL$FLYBASE)]
KE2SY <-function(kk_GSEA, COL){
if( nrow(kk_GSEA@result) >0){
for(i in c(1:nrow(kk_GSEA@result))){
LIST <- kk_GSEA@result[[COL]][i]
kk_GSEA@result[[COL]][i] <- paste(Gene_list$SYMBOL[match(str_remove(str_split(LIST, "/")[[1]], "Dmel_"),Gene_list$FLYBASECG )], collapse = "/")
}
}
return(kk_GSEA)
}
EN2SY <-function(WikiP_enrich, COL){
if(length(WikiP_enrich@result[[COL]])>0){
for(i in c(1:length(WikiP_enrich@result[[COL]]))){
LIST <- WikiP_enrich@result[[COL]][i]
WikiP_enrich@result[[COL]][i] <- paste(Gene_list$SYMBOL[match(str_remove(str_split(LIST, "/")[[1]], "Dmel_"),Gene_list$ENTREZID )], collapse = "/")
}
}
return(WikiP_enrich)
}
ggsave_GO <- function(NAME, LEN){
BASE = 3.8
RATE = 0.125
if (BASE + RATE*LEN <= 40){
W = BASE + RATE*LEN
}else{
W = 40
}
ggsave(NAME , w = W, h = 8.35, limitsize = FALSE )
}
ggsave_GO_enrich <- function(NAME, LEN){
BASE = 2
RATE = 0.1114
if (BASE + RATE*LEN <= 40){
H = BASE + RATE*LEN
}else{
H = 40
}
ggsave(NAME , w = 10, h = H, limitsize = FALSE)
}
ridgeplot_save <- function(NAME,LEN){
BASE = 1.02
RATE = 0.2
if (BASE + RATE*LEN <= 40){
H = BASE + RATE*LEN
}else{
H = 40
}
ggsave(NAME , w = 10, h = H, limitsize = FALSE)
}
TMP <- Gene_list[abs(Gene_list$logFC) >=2,]
TMP <- TMP[TMP$PValue <= Pvalue,]
sig_genes = TMP$ENTREZID
gooc <- groupGO(gene = sig_genes,
OrgDb = org.Dm.eg.db,
ont = "CC",
level = Level,
readable = TRUE)
goom <- groupGO(gene = sig_genes,
OrgDb = org.Dm.eg.db,
ont = "MF",
level = Level,
readable = TRUE)
goob <- groupGO(gene = sig_genes,
OrgDb = org.Dm.eg.db,
ont = "BP",
level = Level,
readable = TRUE)
gooc@result$Group = "CC"
goom@result$Group = "MF"
goob@result$Group = "BP"
GO_TB <- rbind(gooc@result, goom@result, goob@result)
GO_TB <- GO_TB[GO_TB$Count!=0,]
File_name = paste("Ontology", SampleA,SampleB,Pvalue, logFC, sep="_" )
write.csv(GO_TB, paste("GO/",Sample_Dir, File_name, ".csv", sep="" ), row.names=F)
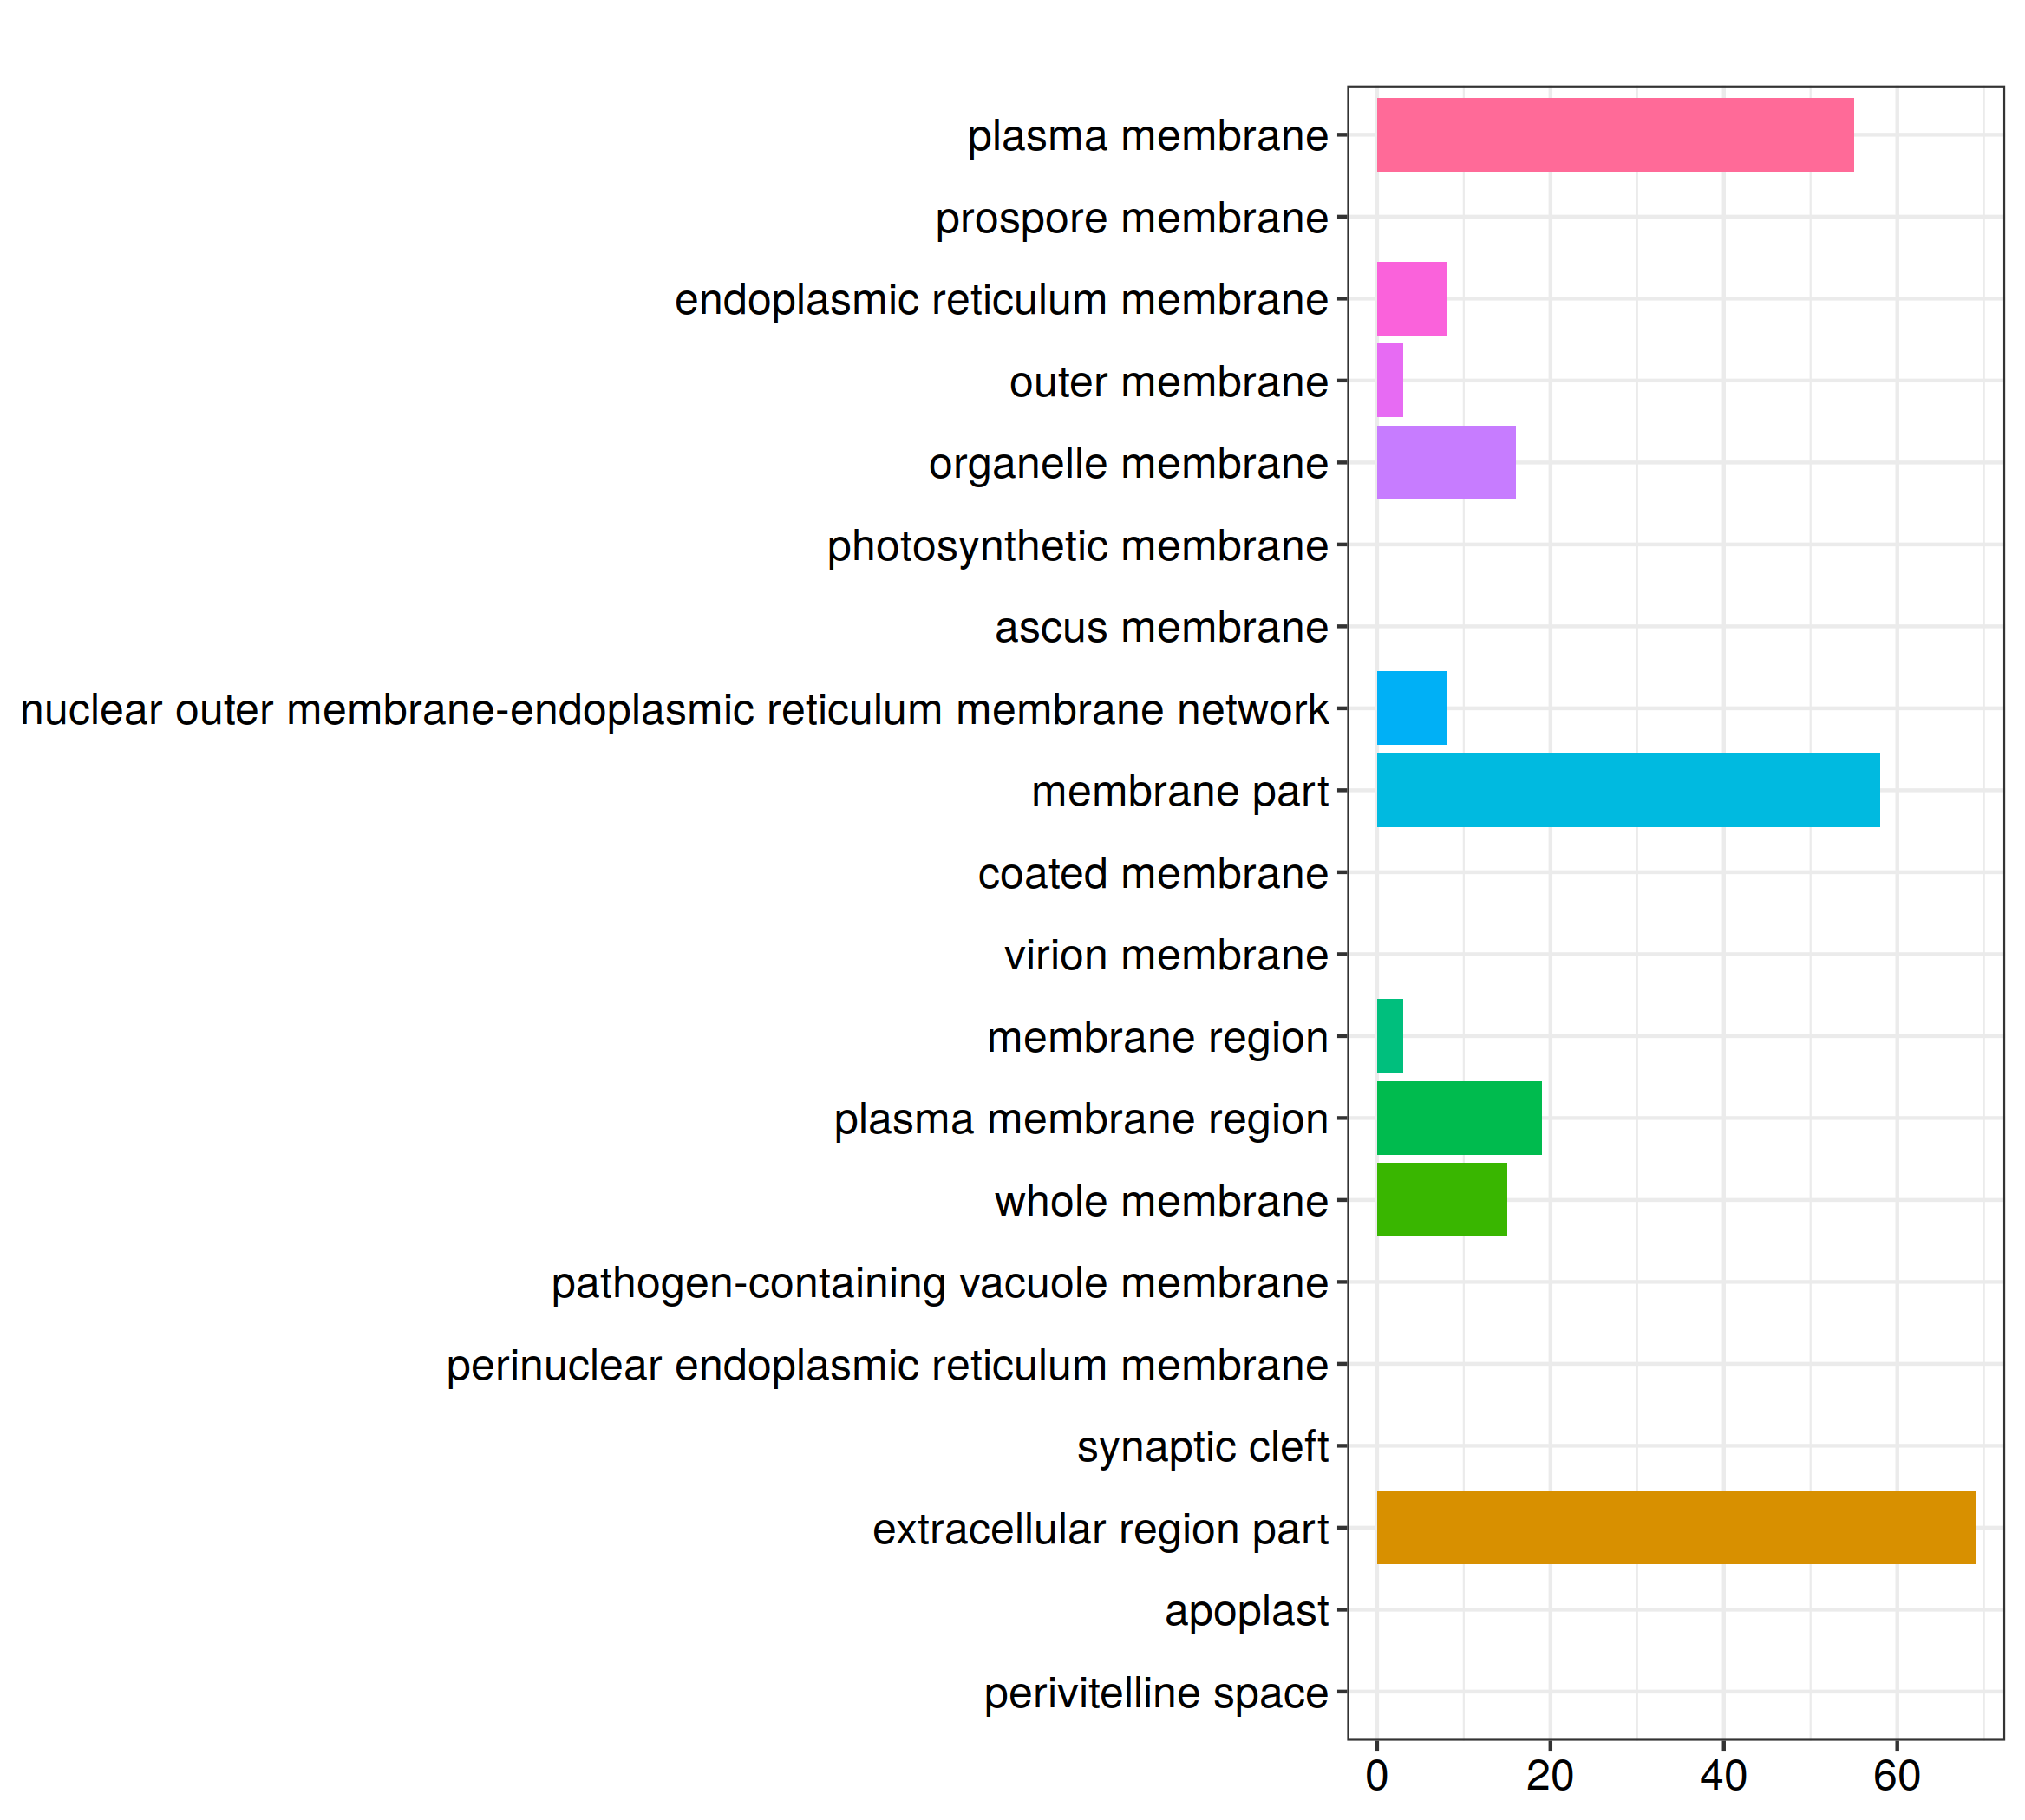
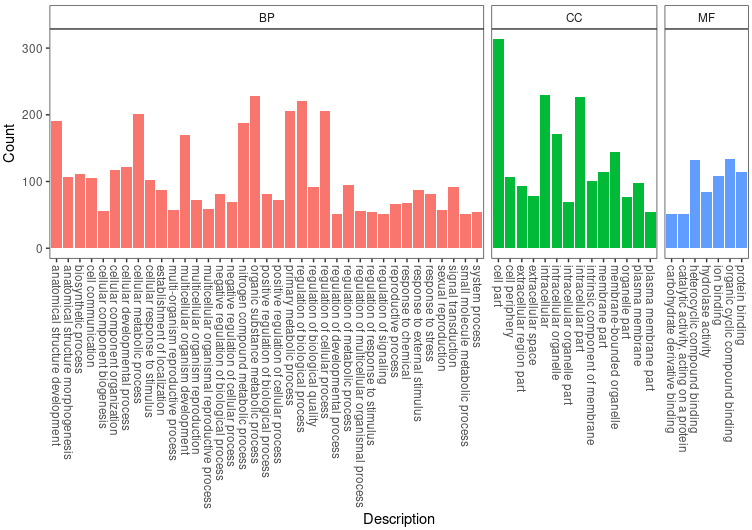
ggplot(GO_TB, aes(x=Description, y=Count, fill=Group)) +
geom_bar(stat = 'identity') +
facet_grid(~Group, scales = 'free', space = 'free') + theme_bw() +
theme(axis.text.x = element_text(angle = 270, hjust = 0, vjust = .5), legend.position = 'none', panel.grid = element_blank(), strip.background = element_rect(fill = 'white'))
ggsave_GO(paste("GO/", Sample_Dir, File_name, ".png", sep="" ), nrow(GO_TB))
File_name = paste("Enrichment", SampleA,SampleB,Pvalue, logFC, sep="_" )
ego <- enrichGO(gene = sig_genes,
universe = Gene_list$ENTREZID,
OrgDb = org.Dm.eg.db,
ont = "All",
pAdjustMethod = "BH",
pvalueCutoff = 0.01,
qvalueCutoff = 0.05,
readable = TRUE)
head(ego)
SIZE = as.numeric(as.character(as.data.frame(str_split_fixed(ego@result$GeneRatio, "/",2))[[1]]))/
as.numeric(as.character(as.data.frame(str_split_fixed(ego@result$BgRatio, "/",2))[[1]]))
ego@result$size = SIZE
write.csv(ego, paste("GO/", Sample_Dir, File_name, ".csv", sep="" ), row.names=F)
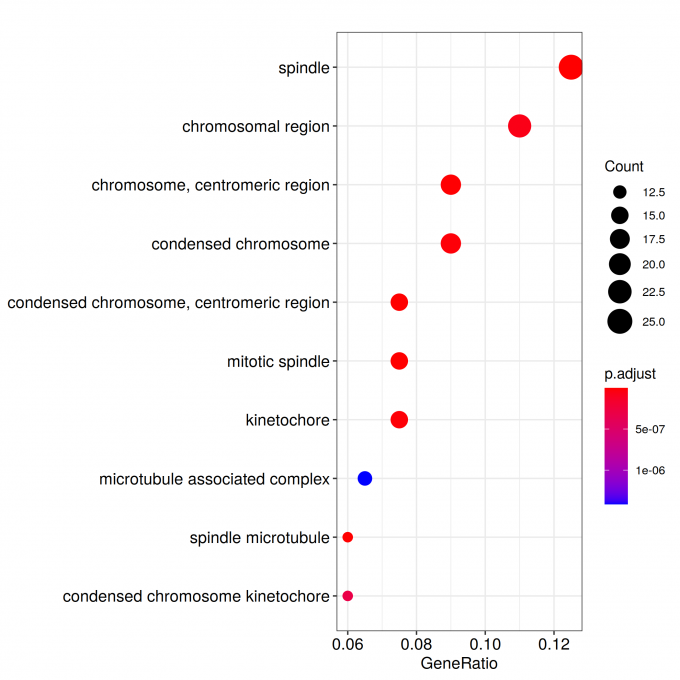
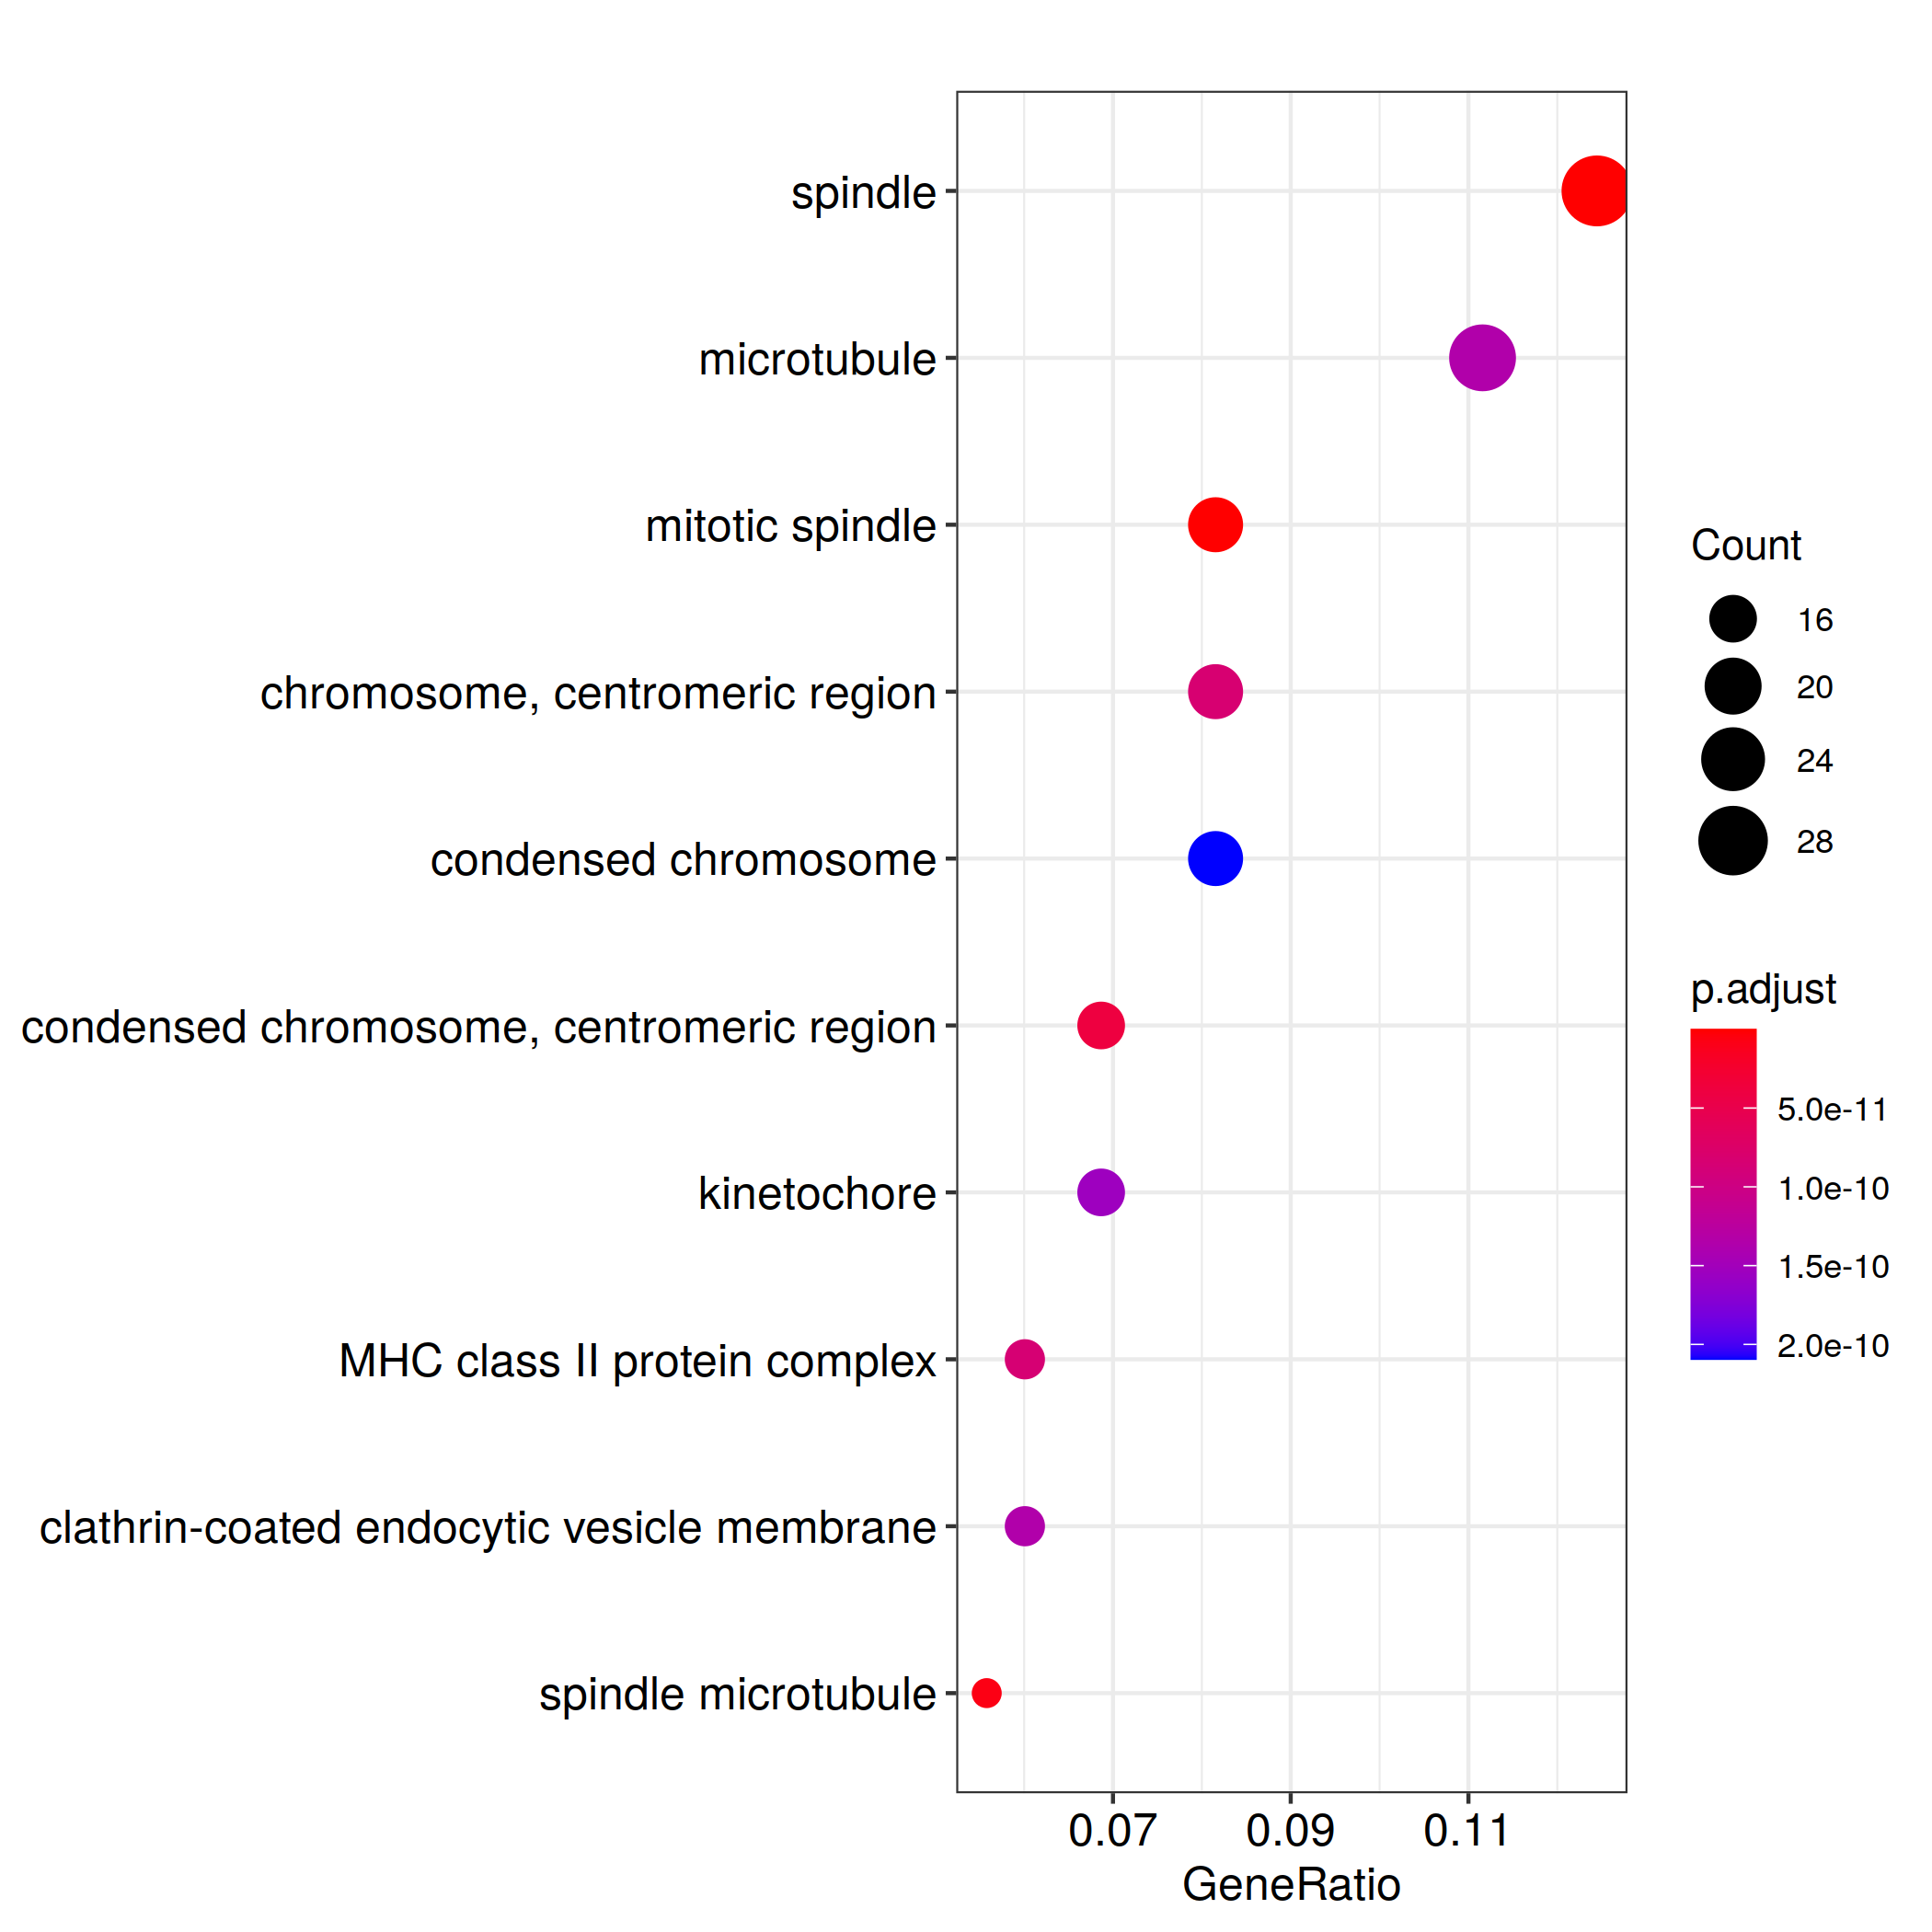
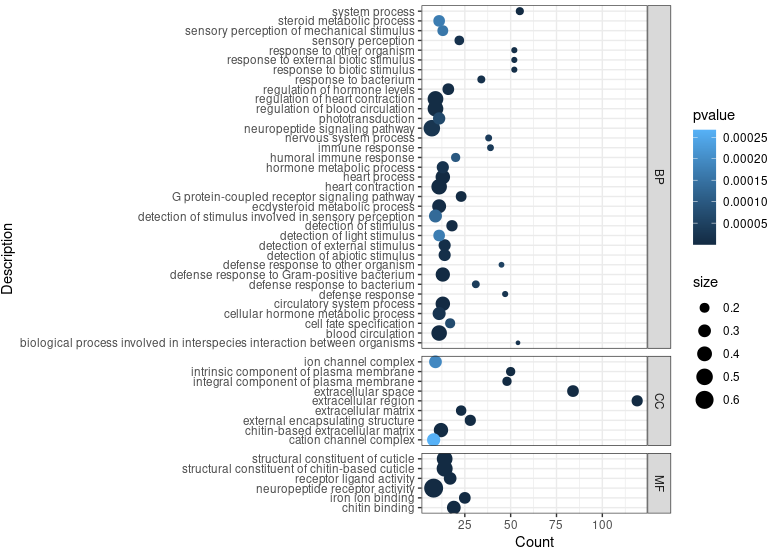
ggplot(ego@result, aes(x=Count, y=Description)) +
geom_point(aes(size=size, color=pvalue)) + theme_bw() +
facet_grid(ONTOLOGY~., space = 'free', scales = 'free')
ggsave_GO_enrich(paste("GO/", Sample_Dir, File_name, ".png", sep="" ), nrow(ego@result))
geneList <- Gene_list$logFC
names(geneList) <- Gene_list$ENTREZID
geneList <- sort(geneList, decreasing = T)
for(GROUP in c("CC", "BP", "MF")){
egocc <- enrichGO(gene = sig_genes,
universe = Gene_list$ENTREZID,
OrgDb = org.Dm.eg.db,
ont = GROUP,
pAdjustMethod = "BH",
pvalueCutoff = 0.01,
qvalueCutoff = 0.05,
readable = TRUE)
write.csv(egocc, paste("GO/",Sample_Dir, File_name, "_", GROUP, ".csv", sep="" ), row.names=F)
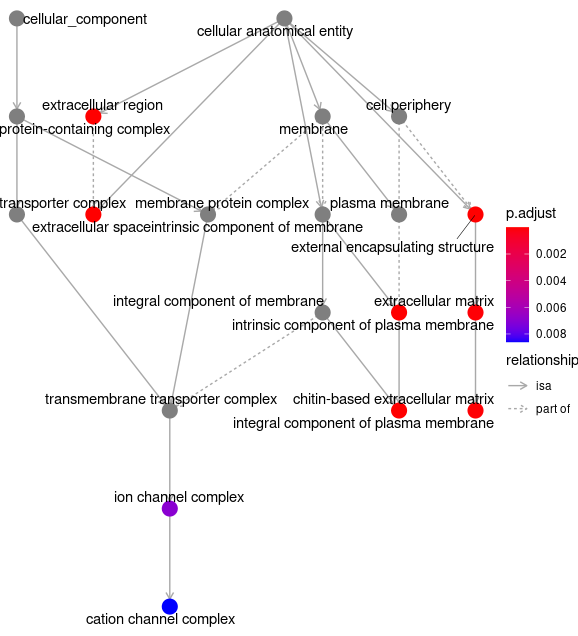
Plot_and_Save <-function(){
goplot(egocc)
ggsave( paste("GO/",Sample_Dir, File_name, "_", GROUP, "_category", ".png", sep="" ),
w = 20, h = 10.9 )
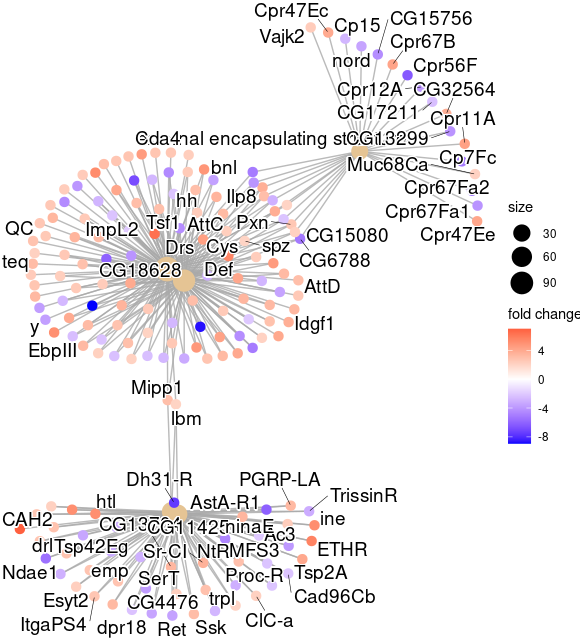
cnetplot(egocc, foldChange=geneList)
ggsave( paste("GO/", Sample_Dir, File_name, "_", GROUP, "_genes", ".png", sep="" ),
w = 20, h = 10.9 )
}
try(Plot_and_Save(),silent=TRUE)
}
File_name = paste("GSEA",Pvalue, logFC, sep="_" )
for(GROUP in c("CC", "BP", "MF")){
GOgse_CC <- gseGO(geneList = geneList,
OrgDb = org.Dm.eg.db,
ont = GROUP,
minGSSize = 100,
maxGSSize = 500,
eps = 1e-10,
pvalueCutoff = 0.05,
verbose = FALSE)
write.csv(GOgse_CC, paste("GO/",Sample_Dir, File_name, "_", GROUP, ".csv", sep="" ), row.names=F)
ridgeplot(GOgse_CC)
ridgeplot_save(paste("GO/",Sample_Dir, File_name, "_", GROUP,"_ridgeplot.png", sep="" ), nrow(GOgse_CC@result))
Plot_and_Save <-function(){
goplot(GOgse_CC)
ggsave( paste("GO/",Sample_Dir, File_name, "_", GROUP, "_category", ".png", sep="" ),
w = 20, h = 10.9 )
cnetplot(GOgse_CC, foldChange=geneList)
ggsave( paste("GO/",Sample_Dir, File_name, "_", GROUP, "_genes", ".png", sep="" ),
w = 20, h = 10.9 )
}
try(Plot_and_Save(),silent=TRUE)
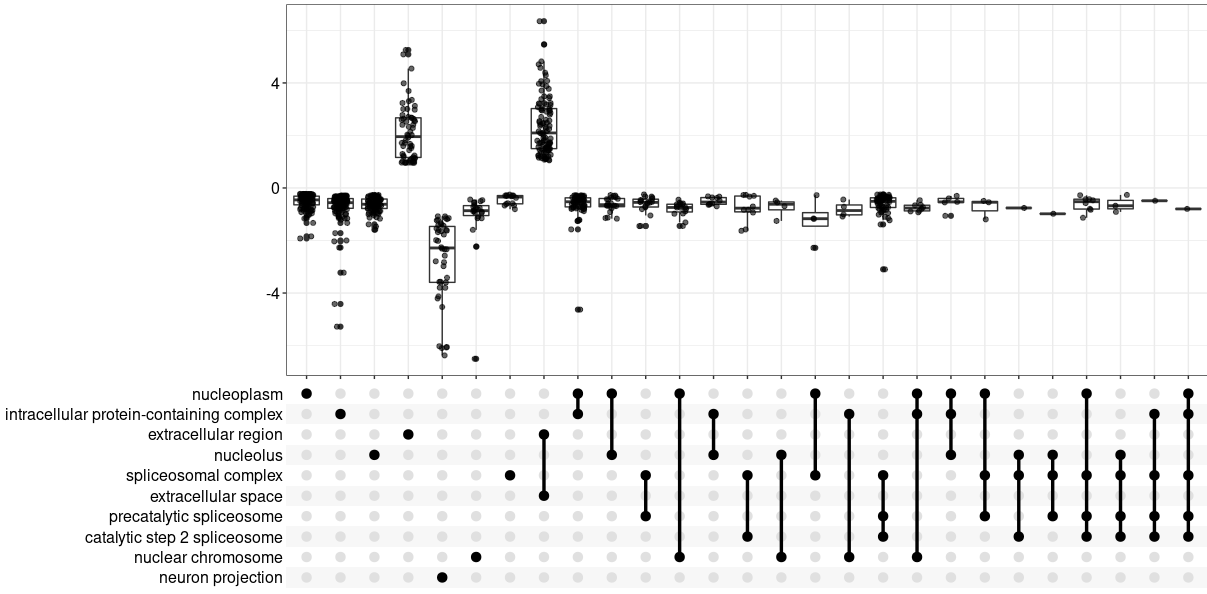
upsetplot(GOgse_CC)
ggsave( paste("GO/",Sample_Dir, File_name, "_", GROUP, "_upset", ".png", sep="" ),
w = 20, h = 10.9 )
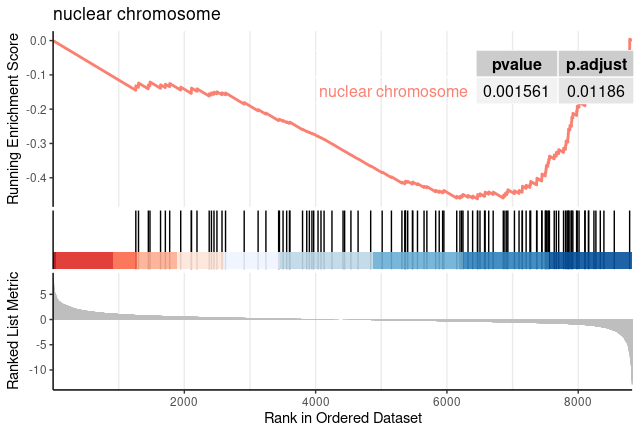
for (i in c(1:nrow(GOgse_CC@result))){
gseaplot2(GOgse_CC, geneSetID = i, title = GOgse_CC$Description[i], color = 'salmon', pvalue_table = TRUE)
ggsave(paste("GO/",Sample_Dir, File_name, "_", str_split(GOgse_CC@result$ID[i],":")[[1]][2], "_GSEA", ".png", sep="" ), w = 7.5, h = 5)
}
}
File_name = paste("GSEA",Pvalue, logFC, sep="_" )
geneList_kk <- Gene_list$logFC
names(geneList_kk) <- paste("Dmel", Gene_list$FLYBASECG, sep="_")
geneList_kk <- sort(geneList_kk, decreasing = T)
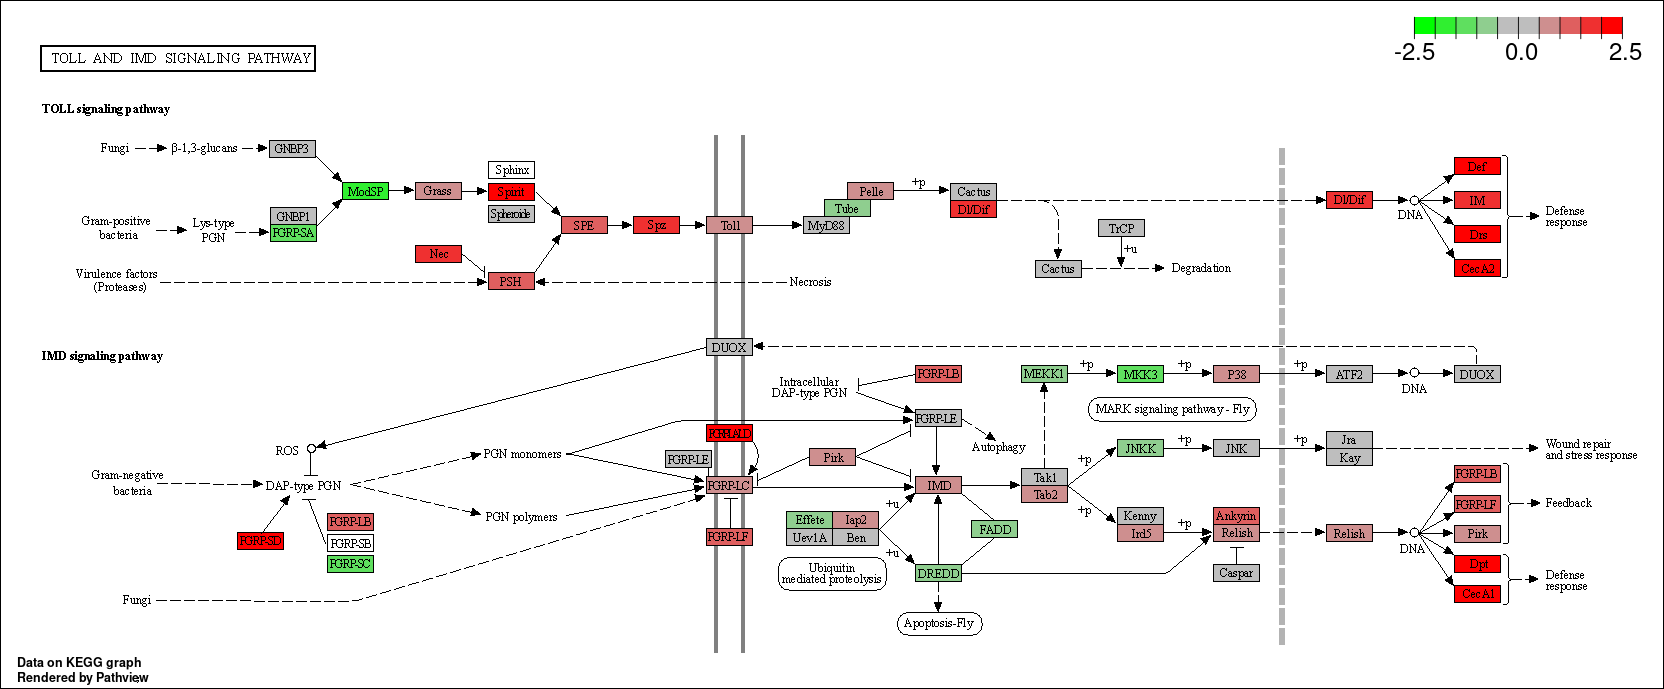
kk_GSEA <- gseKEGG(geneList = geneList_kk,
organism = 'dme',
minGSSize = 10,
pvalueCutoff = 0.05,
verbose = FALSE)
for (i in c(1:nrow(kk_GSEA@result))){
gseaplot2(kk_GSEA, geneSetID = i, title = kk_GSEA$Description[i], color = 'salmon', pvalue_table = TRUE)
ggsave(paste("KEGG/",Sample_Dir, File_name, "_", kk_GSEA@result$ID[i], "_GSEA", ".png", sep="" ), w = 7.5, h = 5)
}
kk_GSEA2 <- KE2SY(kk_GSEA, "core_enrichment")
write.csv(kk_GSEA2, paste("KEGG/",Sample_Dir, File_name, ".csv", sep="" ), row.names=F)
geneList_smb <- Gene_list$logFC
names(geneList_smb) <-Gene_list$SYMBOL
geneList_smb <- sort(geneList_smb, decreasing = T)
Plot_and_Save <-function(){
cnetplot(kk_GSEA2, foldChange=geneList_smb)
ggsave( paste("KEGG/",Sample_Dir, File_name, "_genes", ".png", sep="" ), w = 20, h = 10.9 )
}
try(Plot_and_Save(),silent=TRUE)
sig_genes_kk = paste("Dmel", TMP$FLYBASECG, sep="_")
File_name = paste("Enrichment", Pvalue, logFC, sep="_" )
kk_Enrich <- enrichKEGG(gene = sig_genes_kk,
universe = names(geneList_kk),
organism = 'dme',
pvalueCutoff = 0.05)
write.csv(kk_Enrich, paste("KEGG/",Sample_Dir, File_name, ".csv", sep="" ), row.names=F)
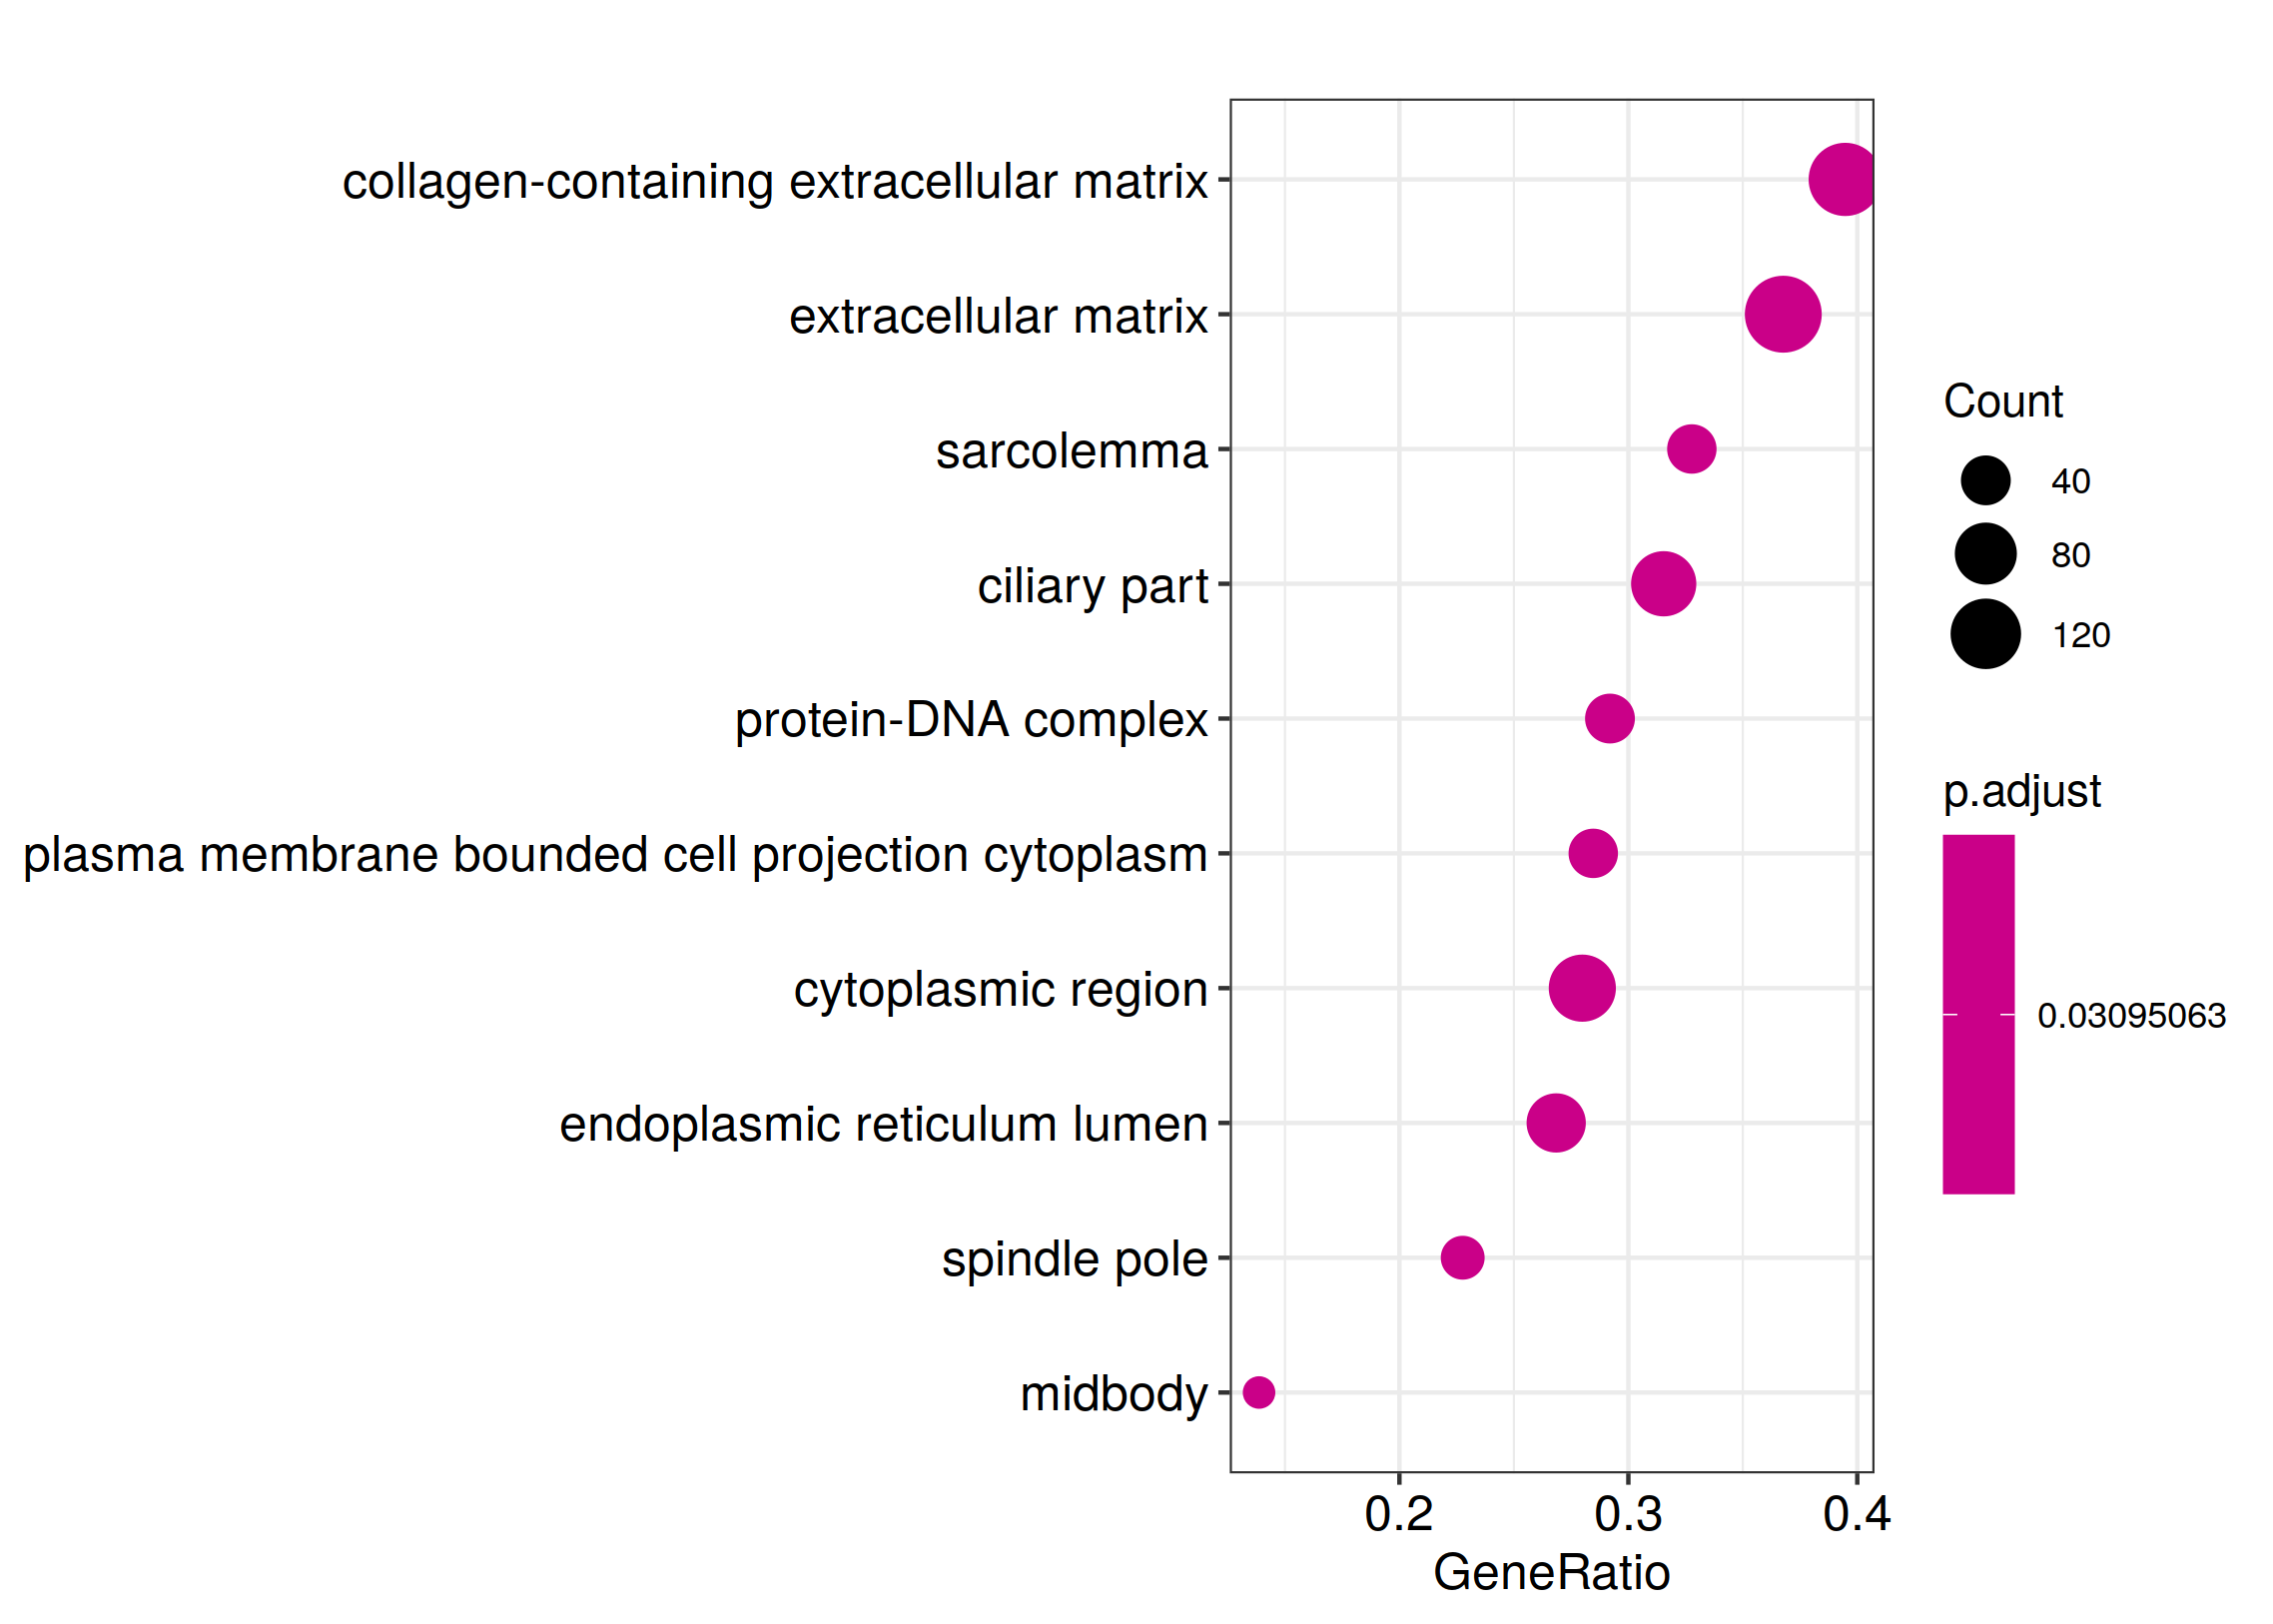
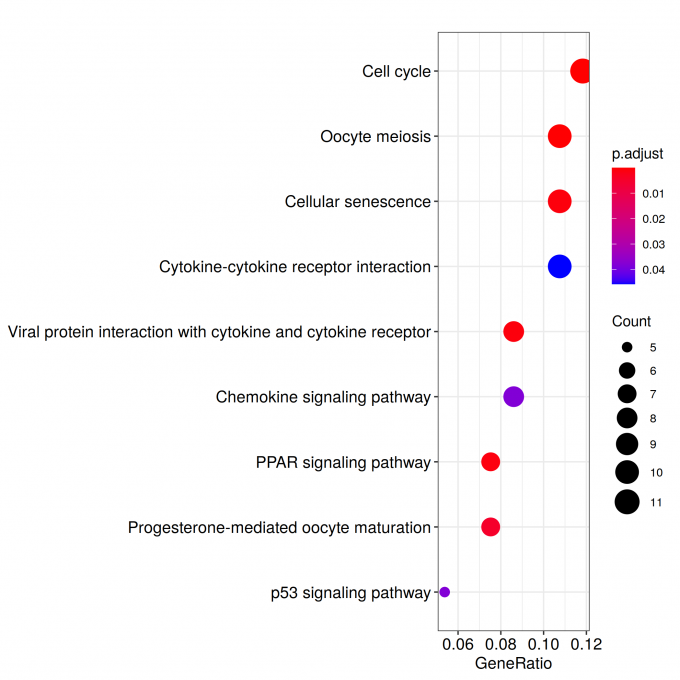
ggplot(kk_Enrich@result, aes(x=Count, y=Description)) +
geom_point(aes(size=GeneRatio, color=pvalue)) + theme_bw()
ggsave_GO_enrich(paste("KEGG/",Sample_Dir, File_name, ".png", sep="" ), nrow(kk_Enrich@result))
Plot_and_Save <-function(){
cnetplot(kk_Enrich, foldChange=geneList_kk)
ggsave( paste("KEGG/",Sample_Dir, File_name, "_genes", ".png", sep="" ), w = 20, h = 10.9 )
}
try(Plot_and_Save(),silent=TRUE)
neList_kk <- Gene_list$logFC
names(geneList_kk) <-Gene_list$ENTREZID
geneList_kk <- sort(geneList_kk, decreasing = T)
library("pathview")
File_name = paste("Enrichment", Pvalue, logFC, sep="_" )
WikiP_enrich <- enrichWP(sig_genes, universe = names(geneList_kk), organism = "Drosophila melanogaster")
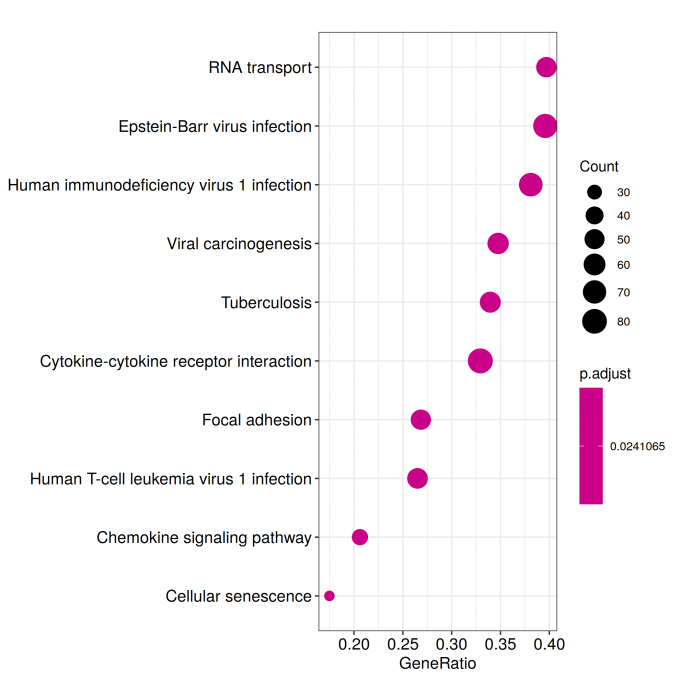
ggplot(WikiP_enrich@result, aes(x=Count, y=Description)) +
geom_point(aes(size=GeneRatio, color=pvalue)) + theme_bw()
ggsave_GO_enrich(paste("WIKI/",Sample_Dir, File_name, ".png", sep="" ), nrow(kk_Enrich@result))
WikiP_enrich2 <- EN2SY(WikiP_enrich, "geneID")
write.csv(WikiP_enrich2@result, paste("WIKI/",Sample_Dir, File_name, ".csv", sep="" ), row.names=F)
Plot_and_Save <-function(){
cnetplot(WikiP_enrich2, foldChange=geneList_smb)
ggsave( paste("WIKI/",Sample_Dir, File_name, "_genes", ".png", sep="" ), w = 20, h = 10.9 )
}
try(Plot_and_Save(),silent=TRUE)
File_name = paste("GSEA",Pvalue, logFC, sep="_" )
WikiP_gse <- gseWP(geneList, organism = "Drosophila melanogaster")
WikiP_gse2 <- EN2SY(WikiP_gse, "core_enrichment")
if (nrow(WikiP_gse@result) >0 ){
for (i in c(1:nrow(WikiP_gse@result))){
gseaplot2(WikiP_gse, geneSetID = i, title = WikiP_gse$Description[i], color = 'salmon', pvalue_table = TRUE)
ggsave(paste("WIKI/",Sample_Dir, File_name, "_", WikiP_gse@result$ID[i], "_GSEA", ".png", sep="" ), w = 7.5, h = 5)
}
}
write.csv(WikiP_gse2@result, paste("WIKI/",Sample_Dir, File_name, ".csv", sep="" ), row.names=F)
Plot_and_Save <-function(){
ridgeplot(WikiP_gse)
ridgeplot_save(paste("WIKI/",Sample_Dir, File_name, "_", GROUP,"_ridgeplot.png", sep="" ), nrow(WikiP_gse@result))
}
try(Plot_and_Save(),silent=TRUE)
library(ReactomePA)
File_name = paste("Enrichment", Pvalue, logFC, sep="_" )
Reactome_enrich <- enrichPathway(gene= sig_genes, pvalueCutoff = 0.05,
readable=TRUE, organism ="fly", universe = names(geneList))
write.csv(Reactome_enrich, paste("Reactome/",Sample_Dir, File_name, ".csv", sep="" ), row.names=F)
Reactome_enrich@result <- Reactome_enrich@result[Reactome_enrich@result$pvalue<=0.05,]
ggplot(Reactome_enrich@result, aes(x=Count, y=Description)) +
geom_point(aes(size=GeneRatio, color=pvalue)) + theme_bw()
ggsave_GO_enrich(paste("Reactome/",Sample_Dir, File_name, ".png", sep="" ), nrow(kk_Enrich@result))
File_name = paste("GSEA",Pvalue, logFC, sep="_" )
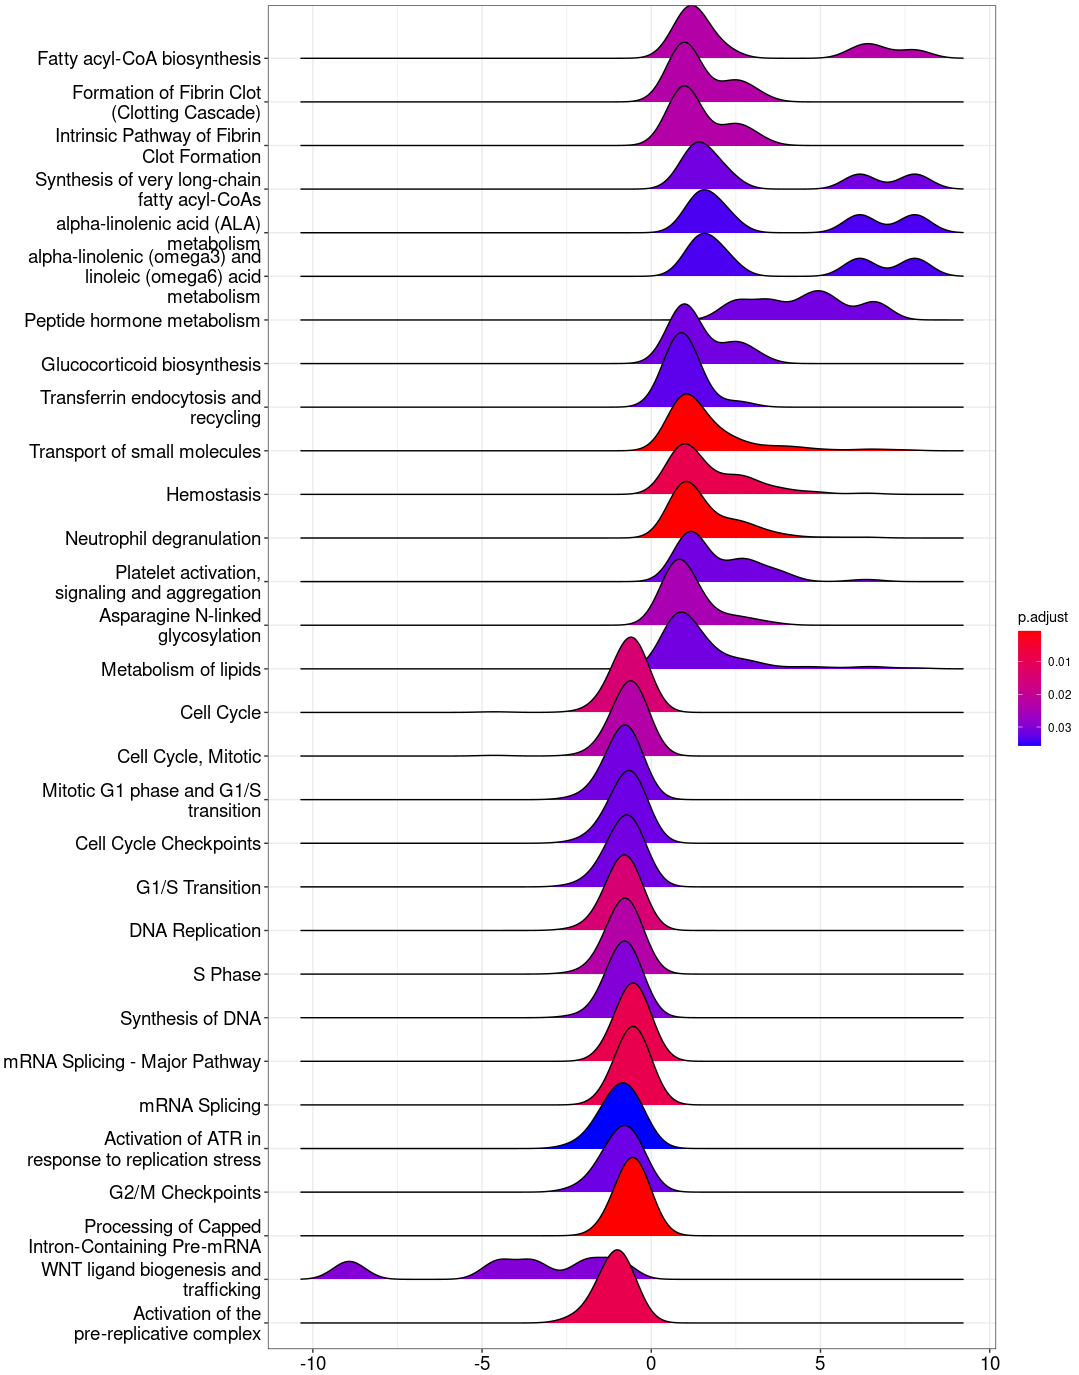
Reactome_gse <- gsePathway(geneList,
pvalueCutoff = 0.05,
organism = "fly",
pAdjustMethod = "BH")
ridgeplot(Reactome_gse)
ridgeplot_save(paste("Reactome/",Sample_Dir, File_name, "_", GROUP,"_ridgeplot.png", sep="" ), nrow(Reactome_gse@result))
write.csv(Reactome_gse, paste("Reactome/",Sample_Dir, File_name, ".csv", sep="" ), row.names=F)
for (i in c(1:nrow(Reactome_gse@result))){
gseaplot2(Reactome_gse, geneSetID = i, title = Reactome_gse$Description[i], color = 'salmon', pvalue_table = TRUE)
ggsave(paste("Reactome/",Sample_Dir, File_name, "_", Reactome_gse@result$ID[i], "_GSEA", ".png", sep="" ), w = 7.5, h = 5)
}
|