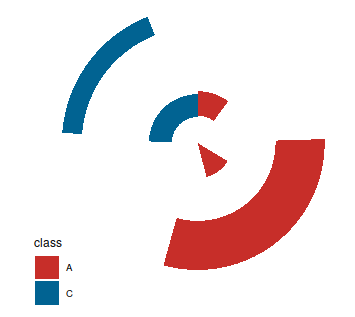
mydata <- data.frame(
  Lebal  = c("Point1","Point2","Point3","Point4","Point5"),
  xstart = c(5.5,15.7,19.5,37.2,36.9),
  xend   = c(9.7,28.1,24.6,44.6,47.1),
  ystart = c(9.6,23.1,2.3,33.2,9.2),
  yend   = c(16.1,36.2,11.7,38.5,15.3),
  size   = c(12,48,30,11.5,28),
  class  = c("A","A","A","C","C")
)

ggplot(mydata)+ geom_rect(aes(xmin = xstart,xmax = xend ,ymin = ystart ,
  ymax = yend , fill = class)) + scale_fill_wsj() + theme_map()
|