R-gganimate | ggplot examples

R-gganimate | ggplot examples

library(ggplot2)
library(gganimate)

ggplot(mtcars, aes(factor(cyl), mpg)) +
geom_boxplot()

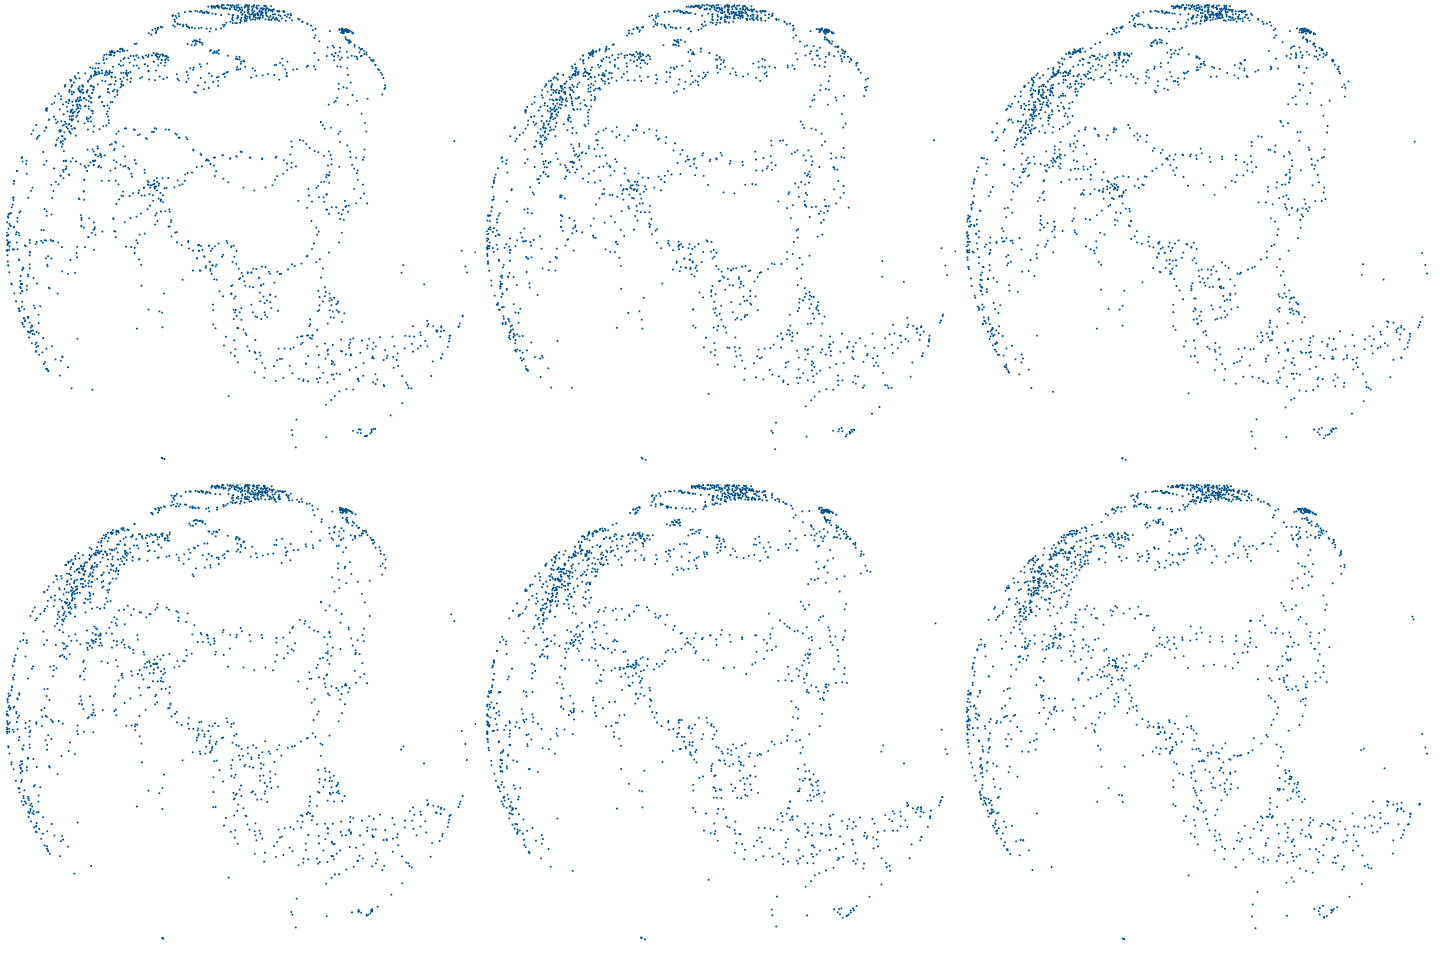
TB= data.frame(Shrink(world,40),Group=1)
Num=1
for(i in c(1:36)){
tmp = data.frame(Shrink(world,40),Group=1)
Num= Num+1
tmp$lat = tmp$lat +rnorm(nrow(tmp),0,1)
tmp$Group=Num
TB = rbind(TB,tmp)
}

## animation::ani.options(ani.width= 1000, ani.height=1000, ani.res = 1000)

ggplot()+ geom_point(data=TB,aes(x=long, y=lat),size=0.3, color="#00518E") +
theme_map() + coord_map("ortho", orientation = c(30, 100, 0)) +
transition_time(Group)

anim_save("map.gif")

Earth

Here comes the gganimate code

transition_states(
gear,
transition_length = 2,
state_length = 1
)
enter_fade()
exit_shrink()
ease_aes('sine-in-out')

Animate bar

https://gganimate.com/

library(gapminder)

ggplot(gapminder, aes(gdpPercap, lifeExp, size = pop, colour = country)) +
geom_point(alpha = 0.7, show.legend = FALSE) +
scale_colour_manual(values = country_colors) +
scale_size(range = c(2, 12)) +
scale_x_log10() +
facet_wrap(~continent)

Here comes the gganimate specific bits

labs(title = 'Year: {frame_time}', x = 'GDP per capita', y = 'life expectancy') +
transition_time(year) +
ease_aes('linear')

save

anim_save("test.gif")

d <- trans_3d_2d(Ball[1:3])

dwqeX4

Author

Karobben

Posted on

2020-06-19

Updated on

2024-01-22

Licensed under

Comments