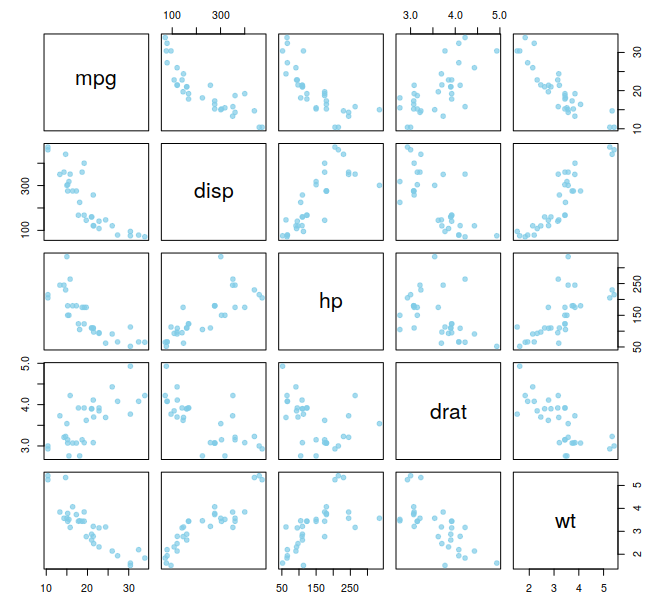
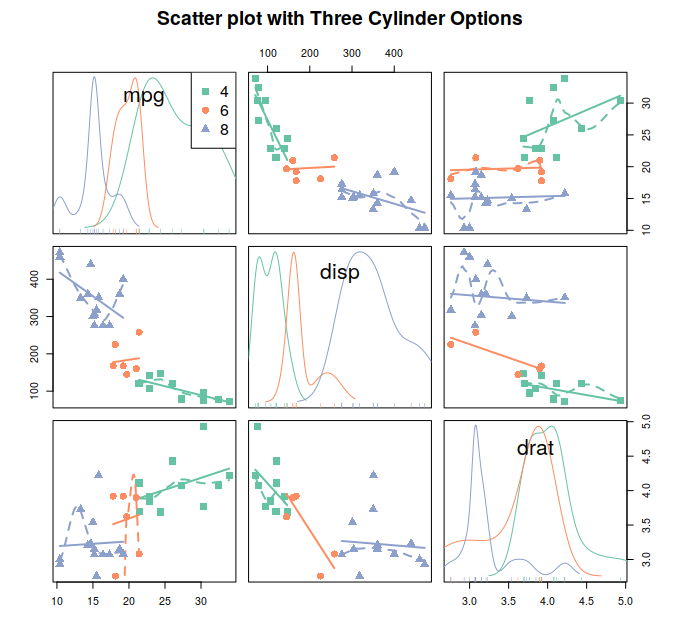
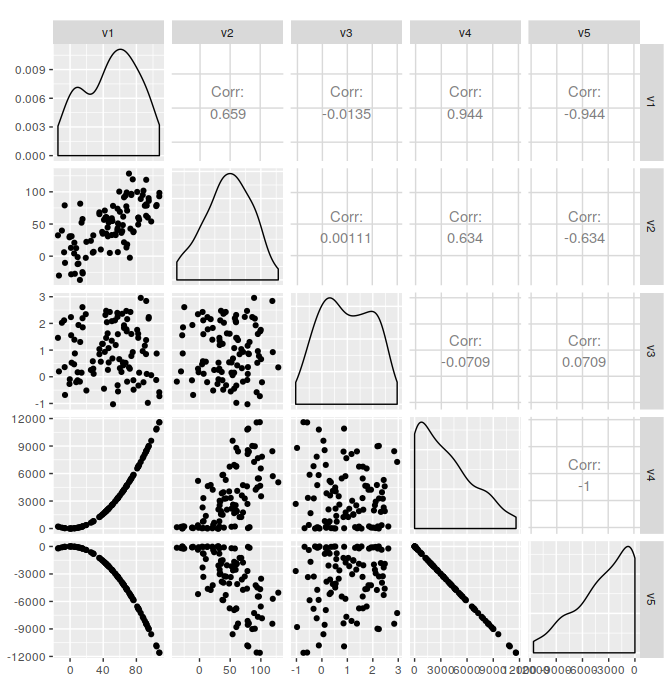
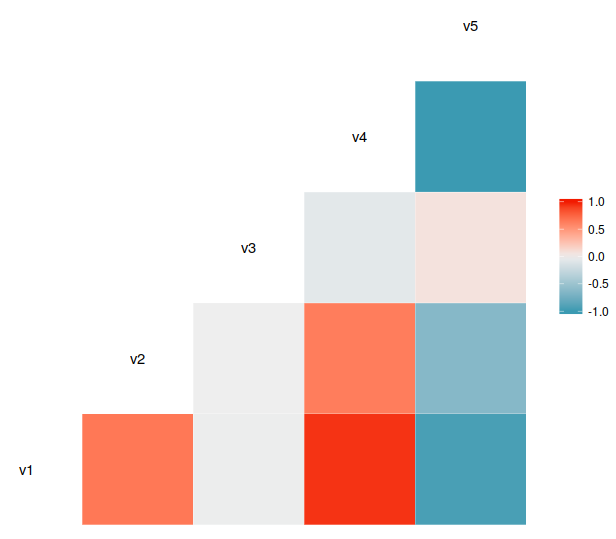
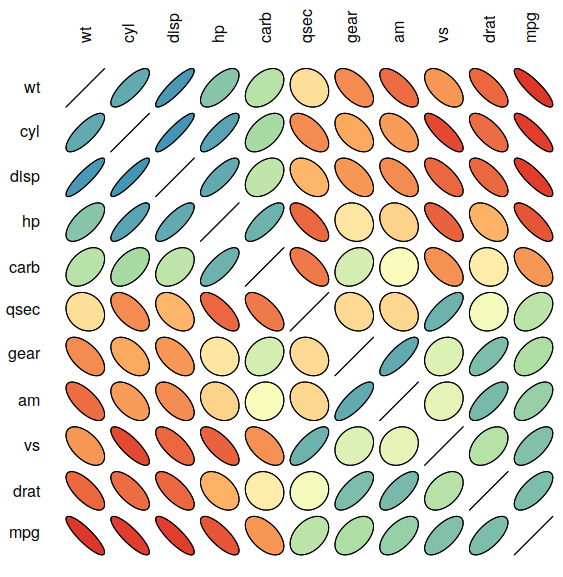
0 Posted 2020-06-28Updated 2024-01-11R / Plot / others2 minutes read (About 226 words)CorrelationCorrelation CORRELATION ELLIPSES library(ellipse)library(RColorBrewer)data=cor(mtcars)##Build a Pannel of 100 colors with Rcolor Brewermy_colors <- brewer.pal(5, "Spectral")my_colors=colorRampPalette(my_colors)(100)##Order the correlation matrixord <- order(data[1, ])data_ord = data[ord, ord]plotcorr(data_ord , col=my_colors[data_ord*50+50] , mar=c(1,1,1,1)) BASIC SCATTERPLOT MATRIX data=mtcars[ , c(1,3:6)]##Make the plotplot(data , pch=20 , cex=1.5 , col=rgb(0.5, 0.8, 0.9, 0.7)) SCATTERPLOT MATRIX – CAR PACKAGE library(car)library(RColorBrewer)##Let's use the car dataset proposed by Rdata=mtcarsmy_colors <- brewer.pal(nlevels(as.factor(data$cyl)), "Set2")scatterplotMatrix(~mpg+disp+drat|cyl, data=data , reg.line="" , smoother="", col=my_colors , smoother.args=list(col="grey") , cex=1.5 , pch=c(15,16,17) , main="Scatter plot with Three Cylinder Options") library(GGally)## Create datasample_data <- data.frame( v1 = 1:100 + rnorm(100,sd=20), v2 = 1:100 + rnorm(100,sd=27), v3 = rep(1, 100) + rnorm(100, sd = 1))sample_data$v4 = sample_data$v1 ** 2sample_data$v5 = -(sample_data$v1 ** 2)## Check correlation between variablescor(sample_data)## Check correlations (as scatterplots), distribution and print corrleation coefficientggpairs(sample_data) # image leftggcorr(sample_data, method = c("everything", "pearson")) # image right More Correlationhttps://karobben.github.io/2020/06/28/R/Correlation/AuthorKarobbenPosted on2020-06-28Updated on2024-01-11Licensed under#RStatisticPlotCluster