Quick Start
library(ggplot2)
library(patchwork)
p1<- ggplot(ChickWeight,aes(x=Time,y=weight)) +
geom_boxplot()+
theme_light() + ggtitle("P1")
ChickWeight$Time <- factor(ChickWeight$Time)
p2<- ggplot(ChickWeight,aes(x=Time,y=weight)) +
geom_boxplot()+
theme_light() + ggtitle("P2")
ChickWeight$Diet <- factor(ChickWeight$Diet)
p3<- ggplot(ChickWeight,aes(x=Time,y=weight)) +
geom_boxplot(aes(fill=Diet))+
theme_light() + ggtitle("P3")
p4<- ggplot(ChickWeight,aes(x=Time,y=weight)) +
geom_boxplot(aes(group=Diet, fill=Diet))+
theme_light() + ggtitle("P4")
GGlay = 'ABBBB
CCCCD'
p1+p2+p3+p4 + plot_layout(design = GGlay)
|
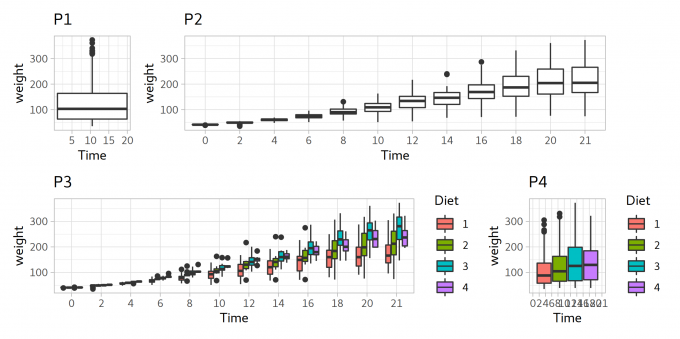
As you can see, we can separate the box by call the axis.x Time as factors (p2).
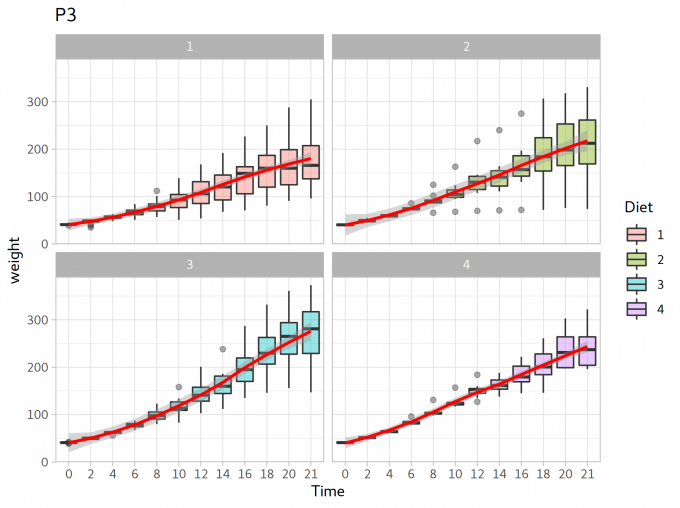
Add smooth line
ggplot(ChickWeight,aes(x=Time,y=weight)) +
        geom_boxplot(aes(fill=Diet),alpha=0.4)+
        theme_light() + ggtitle("P3")+ geom_smooth(aes(group=Diet),color='red')+
        facet_wrap(~Diet)
|