RNA-seq with Trinity
RNA-seq with Trinity
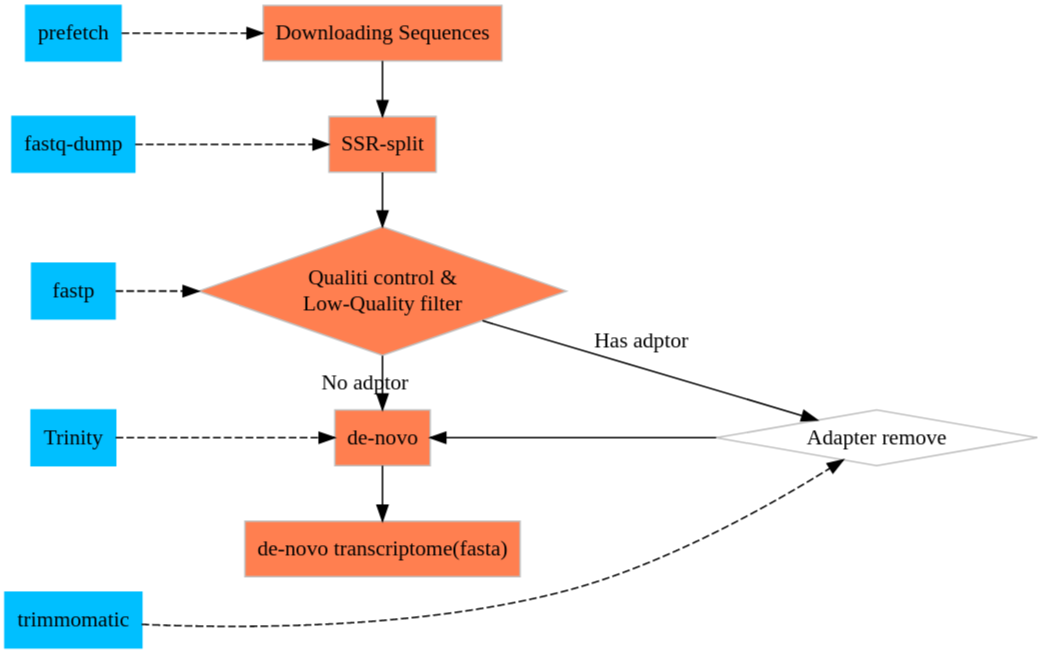
Downloading RNA-Seq sequences
For this practicing, I found a group of mouse RNA-Seq which have replicates and the size of SRA is easy handle for your PC.
SRR14962733 to SRR149627346
|
download with ascp
|
Seq Clean
Turn sra to fastq
|
Quality control
SRA download from NCBI doesn’t included the ASCII grades of the reads now. So, we can’t doing this for free-download reads. I’ll skip this step.
|
De-novo
We recommend generating a single Trinity assembly based on combining all reads across all samples as inputs.
cite: Tirnity wiki
Now, waiting…
|
It takes me 81 min.
errors
Error, do not understand options: fastq/SRR14962734_1.fastq
Result
I made a mistake. With the codes above, I got only three sequences. So, I suspect that mabey this is not RNA-Seq but miRNA-seq. I looked back to the NCBI and checking carefully this time. Guess what? This is a miRNA-Seq! = =
You can find the information in:
Library:
Name: …
Strategy: miRNA-Seq
Now, let’s repeat the codes above with another groups: SRR14962739-SRR14962742
|
check the time consuming:
|
14G	all.fastq
Sun Jul  4 06:20:58 PM CST 2021
Mon Jul  5 02:36:32 AM CST 2021
about 8 hours
Statistical information of the result
Trinity supplied a perl script to calculating and evaluating the result: TrinityStats.pl
It has two group of results:
- Stats based on ALL transcript contigs:
- Stats based on ONLY LONGEST ISOFORM per ‘GENE’:
|
################################
## Counts of transcripts, etc.
################################
Total trinity 'genes':	41400
Total trinity transcripts:	42451
Percent GC: 49.50

########################################
Stats based on ALL transcript contigs:
########################################

	Contig N10: 6068
	Contig N20: 4371
	Contig N30: 3377
	Contig N40: 2687
	Contig N50: 2100

	Median contig length: 426
	Average contig: 991.80
	Total assembled bases: 42102797

#####################################################
## Stats based on ONLY LONGEST ISOFORM per 'GENE':
#####################################################

	Contig N10: 5781
	Contig N20: 4155
	Contig N30: 3202
	Contig N40: 2543
	Contig N50: 1982

	Median contig length: 415
	Average contig: 948.27
	Total assembled bases: 39258319
Downstream Analysis
We are processing the downstream analysis based on the scripts trinity supplied. Most of them are in the ${Trinity directory}/util/
TrinityStats.pl
abundance_estimates_to_matrix.pl
align_and_estimate_abundance.pl
analyze_blastPlus_topHit_coverage.pl
filter_low_expr_transcripts.pl
insilico_read_normalization.pl
retrieve_sequences_from_fasta.pl
sift_bam_max_cov.pl
TrinityStats.pl is for calculating the value of N50
Align and Abundance Estimate
The script, align_and_estimate_abundance.pl, was used here to estimate the abundances of each transcripts from your transcriptome library. More details about this scripts is in trinity wiki
Because we have replicates, we need a file to interpreted the groups. (group.csv)
miR-31    miR-31_rep1    fastq/SRR14962739_1.fastq
miR-31    miR-31_rep2    fastq/SRR14962740_1.fastq
Scr-2    Scr-2_rep1    fastq/SRR14962741_1.fastq
Scr-2    Scr-2_rep2    fastq/SRR14962742_1.fastq
|
It could build index, pair the reads and counting the matched reads automatically.
It using the file automatically generated by Trinity assembly to distinguish the gene and isoform. An example of trinity_{sample}.Trinity.fasta.gene_trans_map looks like below. Two columns are separated by Tab which the first column is Gene ID and the second column is isoform ID.
TRINITY_DN9652_c0_g1	TRINITY_DN9652_c0_g1_i2
TRINITY_DN9653_c0_g1	TRINITY_DN9653_c0_g1_i1
TRINITY_DN9630_c0_g1	TRINITY_DN9630_c0_g1_i1
TRINITY_DN9699_c0_g1	TRINITY_DN9699_c0_g1_i1
TRINITY_DN9681_c0_g1	TRINITY_DN9681_c0_g1_i1
TRINITY_DN9660_c0_g1	TRINITY_DN9660_c0_g1_i1
Not Trinity assembled results
if you don't have this file, you can using parameters --gene_trans_map. The difference between this to parameters are explained in --help
# --gene_trans_mapfile containing 'gene(tab)transcript' identifiers per line. # or # --trinity_mode Setting --trinity_mode will automatically generate the gene_trans_map and use it.
After down, you’ll got a bunch of result. The abaundance file was in the directories miR-31_rep1, miR-31_rep2, Scr-2_rep1, Scr-2_rep2 as the statistic scripts, the result was divided into two groups, gene and isoforms: RSEM.genes.results RSEM.isoforms.results. This is where the count, TPM, and FPKM were generated and stored (If you are using RSEM).
FPKM: fragments per kilobase transcript length per million fragments mapped
TPM: transcripts per million transcripts
|
transcript_id	gene_id	length	effective_length	expected_count	TPM	FPKM	IsoPct
TRINITY_DN10000_c0_g1_i1	TRINITY_DN10000_c0_g1	3506	3457.00	489.00	10.97	6.58	100.00
TRINITY_DN10001_c0_g1_i1	TRINITY_DN10001_c0_g1	441	392.00	15.00	2.97	1.78	100.00
TRINITY_DN10002_c0_g1_i1	TRINITY_DN10002_c0_g1	5392	5343.00	2609.00	37.85	22.73	100.00
TRINITY_DN10003_c0_g1_i1	TRINITY_DN10003_c0_g1	1419	1370.00	1995.00	112.89	67.78	100.00
TRINITY_DN10004_c0_g1_i1	TRINITY_DN10004_c0_g1	3829	3780.00	1715.00	35.17	21.12	100.00
TRINITY_DN10005_c0_g1_i1	TRINITY_DN10005_c0_g1	2379	2330.00	1755.00	58.39	35.06	100.00
How it works with bowtie2 and RSEM
By checking the log of Trinity, the codes from bowtie2 to RSEM could be:
|
- Bowtie2 align reads from
-Uinto indexed reference from-xand bowtie2.bam was created. After that,bowtie2.bam.okwas touched to mark this process is done - bam was converted into
bowtie2.bam.for_rsem.bamand started counting by using RSEM index
Expression matrix
Of course that trinity supplied a script, abundance_estimates_to_matrix.pl, do it for you as well.
|
|
RSEM.gene.TMM.EXPR.matrix		   RSEM.gene.counts.matrix			 RSEM.isoform.TPM.not_cross_norm.runTMM.R
RSEM.gene.TPM.not_cross_norm		   RSEM.isoform.TMM.EXPR.matrix			 RSEM.isoform.counts.matrix
RSEM.gene.TPM.not_cross_norm.TMM_info.txt  RSEM.isoform.TPM.not_cross_norm
RSEM.gene.TPM.not_cross_norm.runTMM.R	   RSEM.isoform.TPM.not_cross_norm.TMM_info.txt
Now, all the matrix were extracted from separated results of samples.
move them into a new directory
|
Errors
- libreadline
/home/ken/miniconda3/envs/Biostation/lib/R/bin/exec/R: error while loading shared libraries: libreadline.so.6: cannot open shared object file: No such file or directory
chech the libreadlines:
|
/lib/libreadline.so /lib/libreadline.so.8 /lib/libreadline.so.8.1
The problem is this script is relying on an very old version. So, you can heck on the script, or cheat it.
This is how I fool the script:
|
- libncurses
/home/ken/miniconda3/envs/Biostation/lib/R/bin/exec/R: error while loading shared libraries: libncurses.so.5: cannot open shared object file: No such file or directory
The same as error 1
|
Low-Expression Reads Filter
The results of the matrix are huge. we got 42451 pieces of isforms but lot’s of them are low expression gene we want to remove. You can achive this by using R. Trinity supplied the related scripts to handle with this, too.
This is the function in R to down the same thing as the scripts from Trinity
|
In trinity, perl scripts, util/misc/count_matrix_features_given_MIN_TPM_threshold.pl, is aiming to that the genes/isoforms expressed above a minimum TPM expression threshold in any sample.
|
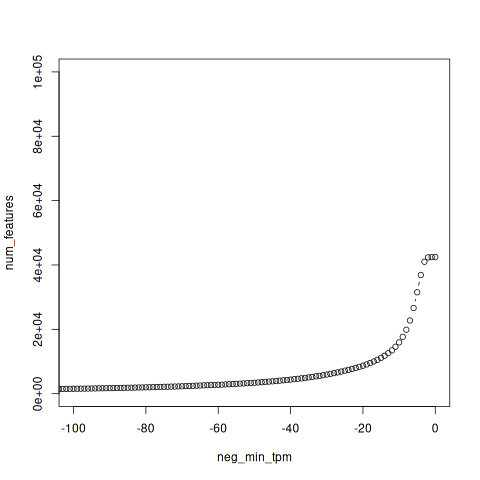
neg_min_tpm	num_features
-6771	1
-6758	2
-6185	3
-6092	4
.
.
.
-4	36909
-3	41004
-2	42353
-1	42440
0	42451
In this result, -1 42440 means that 42440 isoforms’s TPM is larger than 1 in all samples. You can get the same result with the function in R above. (Filter(A, 1))
Ploting the result
|
Plot the result with R
|
Filtering
By the function above, you can easily filtering the matrix from the row matrix. Trinity also supplied a pl script to extracting the transcripts from your transcriptome (you fasta file) to build a new library.
|
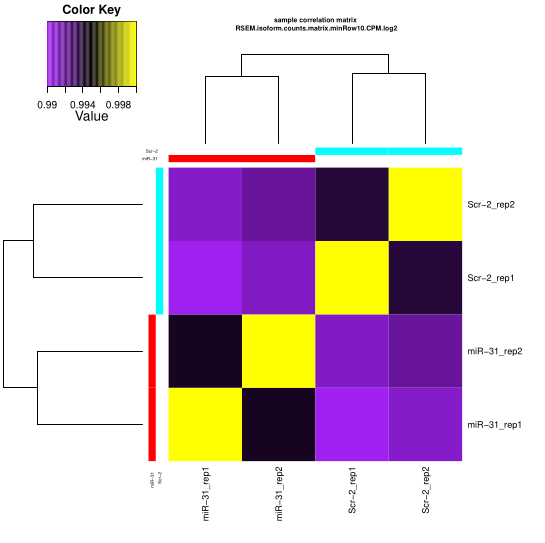
Expression matrix QC
Checking the replicates
relied R packages: fastcluster,
|
Processing replicate QC analysis for sample:  miR-31
for plotting:: min.raw: 0.994299466204194 max.raw: 1
Processing replicate QC analysis for sample:  Scr-2
for plotting:: min.raw: 0.993762297454055 max.raw: 1
You’ll get the PDF result like it’s show in Trnity wiki
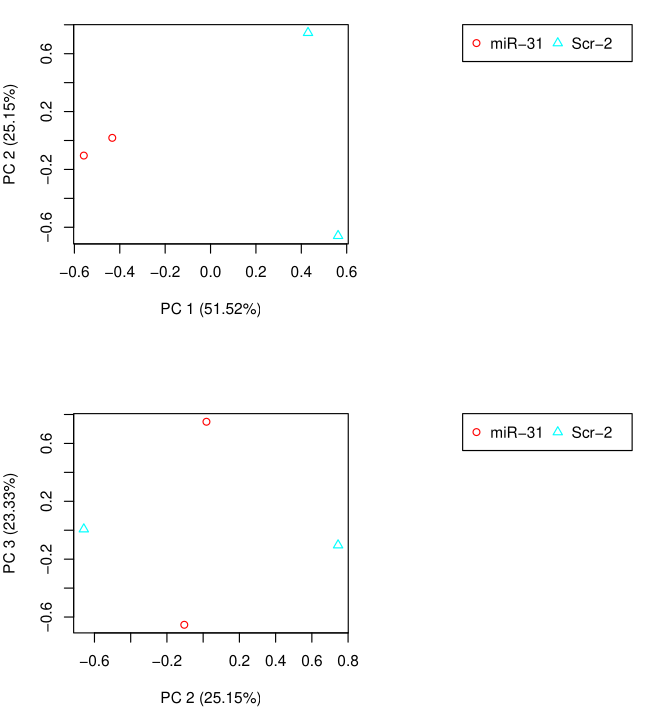
Checking all groups
|
PCA Analysis
|
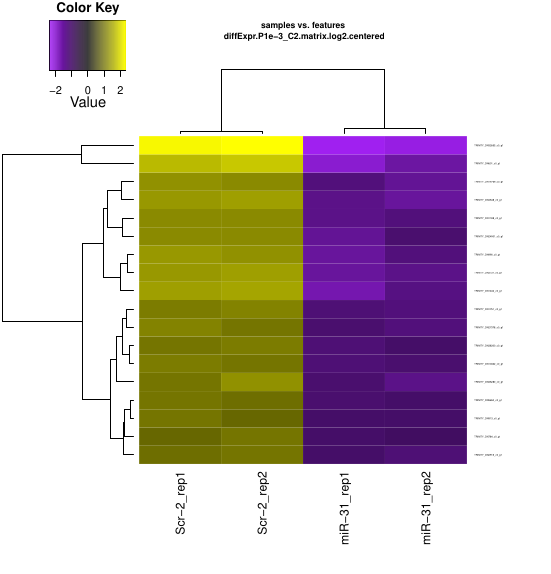
Differential Expression Matrix
Here we are supposed to using counts file for calculating.
|
a voom.******.dir directory was generated by default.
You can also using edgeR/DESeq2 instead of voom
Extracting and clustering differentially expressed transcripts
Now, enter the directory generated above and run codes below
|
Now, you can have the ugly heatmap ^_^
I tried those three different algorithms and get different results.
| Packages | Number of DEGs |
|---|---|
| edgeR | 149 |
| DESeq2 | 167 |
| Voom | 18 |
.
├── DB
│   └── dmel-all-miRNA-r6.39.fasta
├── Merged_FQ
│   └── CF-1_S1.S.fq.gz
└── Trinity.map
|
.
└── CF-1_S1_miRNA
    ├── bowtie2.bam
    ├── bowtie2.bam.for_rsem.bam
    ├── bowtie2.bam.for_rsem.tmp.bam
    ├── bowtie2.bam.ok
    ├── RSEM.genes.results
    ├── RSEM.isoforms.results
    └── RSEM.stat
Now, you can have the result from RSEM.genes.results, or isoform infromation from RSEM.isoforms.results.
RSEM errors
|
rsem-synthesis-reference-transcripts DB/Updated_Drosophila_Viruses.fasta.RSEM 0 1 Trinity.map DB/Updated_Drosophila_Viruses.fasta
FASTA file DB/Updated_Drosophila_Viruses.fasta contains an unknown character, ~ (ASCII code 126), at line 24057, position 43!
"rsem-synthesis-reference-transcripts DB/Updated_Drosophila_Viruses.fasta.RSEM 0 1 Trinity.map DB/Updated_Drosophila_Viruses.fasta" failed! Plase check if you provide correct parameters/options for the pipeline!
The error code is contains an unknown character, ~ (ASCII code 126), at line 24057, position 43! in the second line. By following this codes and check the line 24057, we can find "~" in the sequence.
AGCGCATTGGAGCGGGATTCCGGATCTTACTTCGATGTGGCT~CCCCTCACTC~GCATTG
After cleaned all "~" by using sed, the code passed.
Another Example in Slurm Server
|
RNA-seq with Trinity
https://karobben.github.io/2020/07/28/Bioinfor/RNA-seq-with-Trinity/


