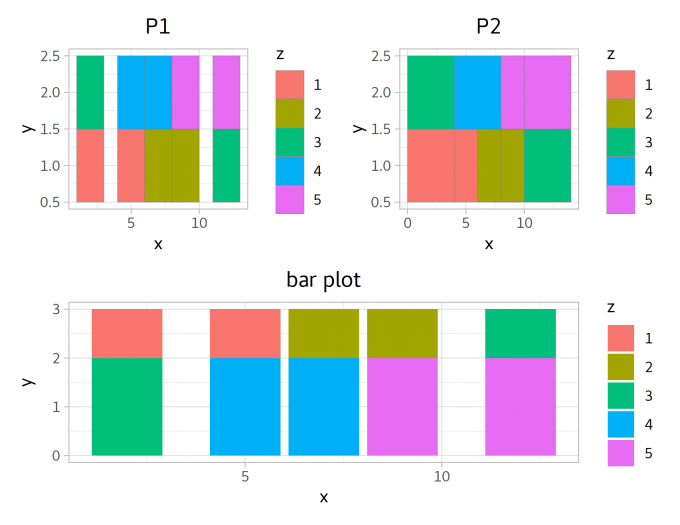
library(ggplot2)
df <- data.frame(
x = rep(c(2, 5, 7, 9, 12), 2),
y = rep(c(1, 2), each = 5),
z = factor(rep(1:5, each = 2)),
w = rep(diff(c(0, 4, 6, 8, 10, 14)), 2)
)
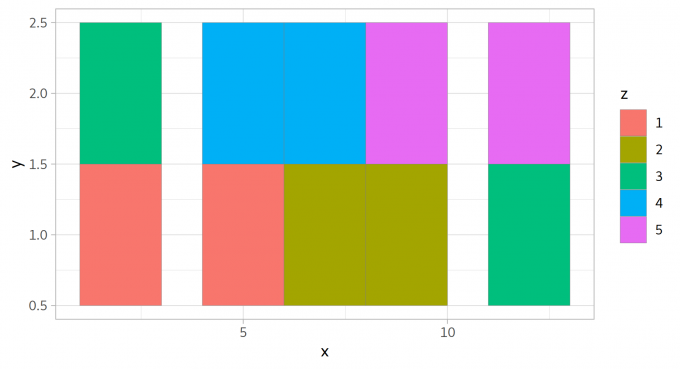
ggplot(df, aes(x, y)) + theme_light()+
geom_tile(aes(fill = z), colour = "grey50")
|