GGradar | ggplot example

GGradar | ggplot example

Project: ricardo-bion 2019

Quick Start

remotes::install_github('ricardo-bion/ggradar')

library(ggplot2)
library(ggradar)

mydata<-matrix(runif(40,0,1),5,8)
rownames(mydata) <- LETTERS[1:5]
colnames(mydata) <- c("Apple","Google","Facebook","Amozon","Tencent","Alibaba","Baidu","Twitter")
mynewdata<-data.frame(mydata)
Name<-c("USA","CHN","UK","RUS","JP")
mynewdata<-data.frame(Name,mynewdata)
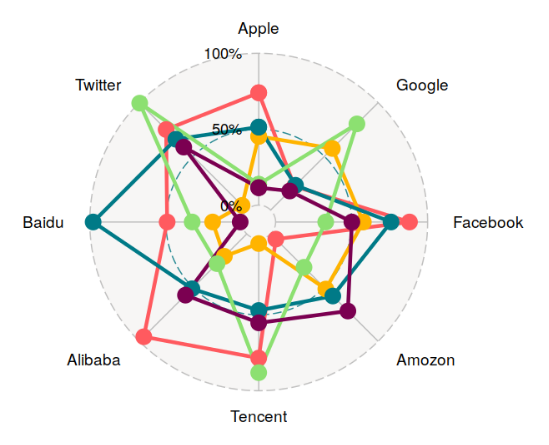
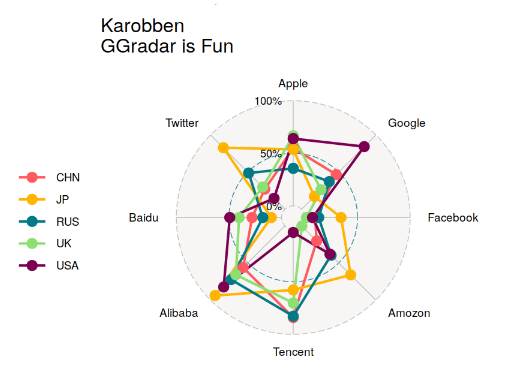
ggradar(mynewdata)

ggradar(mynewdata) + theme(legend.position = 'none')

Sec

##Data structure
'''
Name Apple Google Facebook Amozon Tencent Alibaba Baidu
A USA 0.6028703 0.9975856 0.4771023 0.8630967 0.21543389 0.78643566 0.7611366
B CHN 0.3853622 0.7067794 0.4991334 0.8006687 0.47394478 0.68875340 0.1547279
C UK 0.2634778 0.3165925 0.8032880 0.5479650 0.87007110 0.01701491 0.3585789
D RUS 0.9749844 0.6391640 0.0542372 0.2777984 0.04970435 0.38795458 0.4374871
E JP 0.3928207 0.5548013 0.5891342 0.5367423 0.69436110 0.48937538 0.1104125
'''

Arguments

ggradar(data,axis.label.size = 4,
grid.label.size =7,
group.line.width = 1,
group.point.size = 3,
plot.title = '这啥?')

fmsb

library(fmsb)

set.seed(99)
data=as.data.frame(matrix( sample( 0:20, 15, replace=F) , ncol=5))
colnames(data)=c("math", "english", "biology", "music", "R-coding")
rownames(data)=paste("mister", letters[1:3] , sep="-")
## 用于生成雷达图的最大最小值
data=rbind(rep(20,5) , rep(0,5) , data)
colors_border=c( rgb(0.2,0.5,0.5,0.9), rgb(0.8,0.2,0.5,0.9) , rgb(0.7,0.5,0.1,0.9))
colors_in=c( rgb(0.2,0.5,0.5,0.4), rgb(0.8,0.2,0.5,0.4) , rgb(0.7,0.5,0.1,0.4))

radarchart( data, axistype=1,
pcol=colors_border , pfcol=colors_in , plwd=4, plty=1,
cglcol="grey", cglty=1, axislabcol="grey",
caxislabels=seq(0,20,5), cglwd=0.8, vlcex=0.8)

legend(x=0.7, y=1, legend = rownames(data[-c(1,2),]), bty = "n",
pch=20, col=colors_in , text.col = "grey", cex=1.2, pt.cex=3)

More

Author

Karobben

Posted on

2020-08-13

Updated on

2024-01-11

Licensed under

Comments