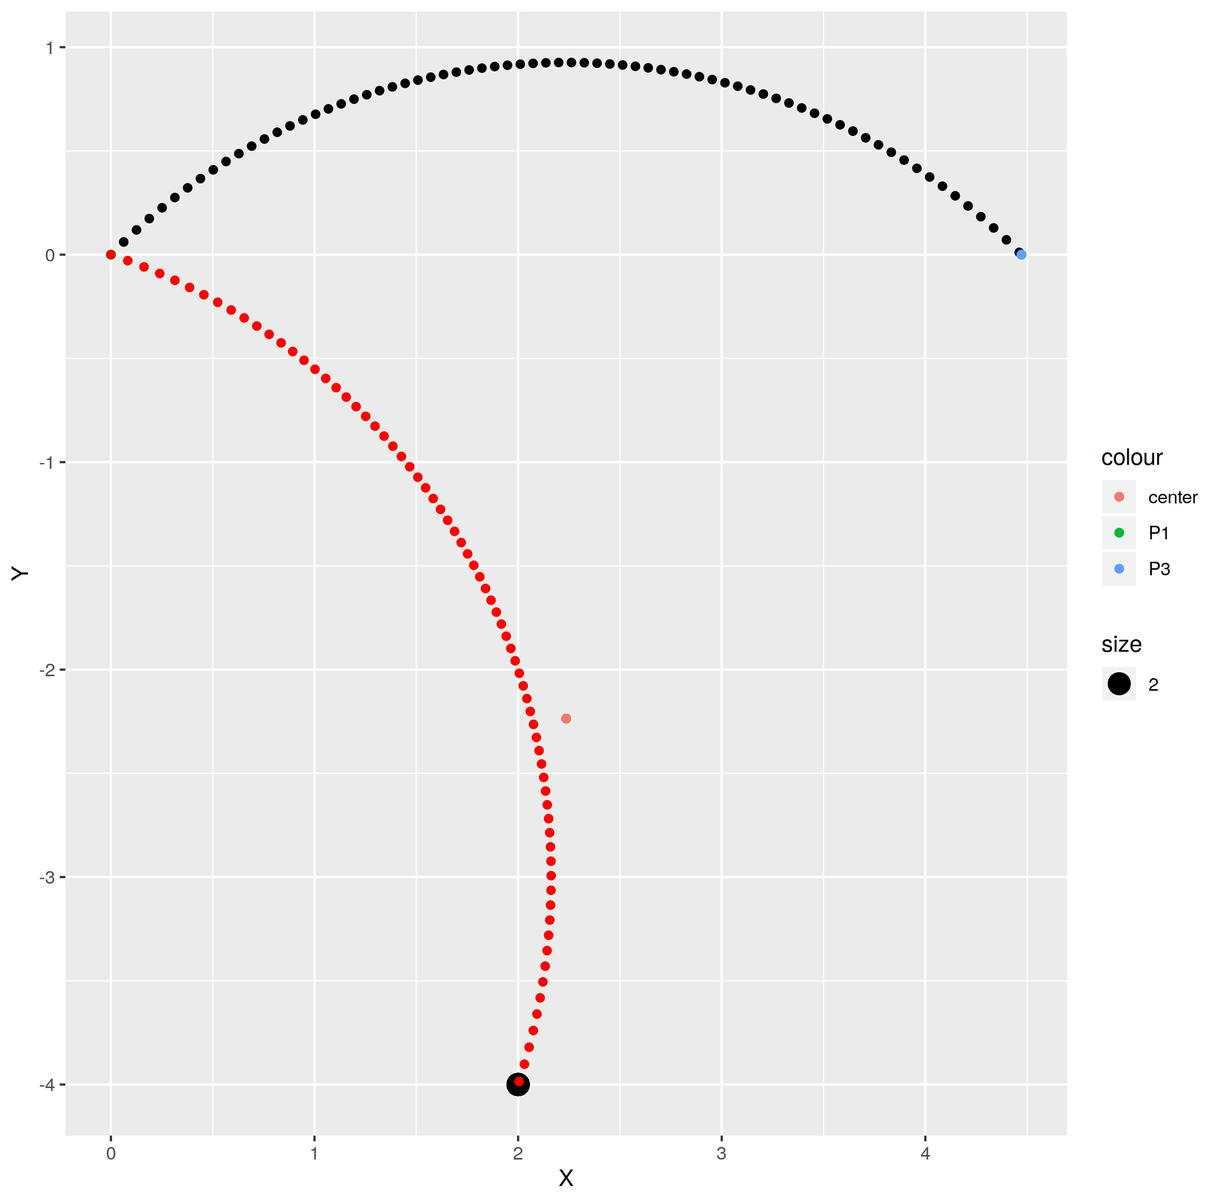
GGplot 杂耍

GGplot 杂耍

1.点

2.线

曲线链接两点

library(ggplot2)
##先从横线线入手

## r*sin(theta/2)=d/2
##2.随机圈上圆点
## r^2 = (x+a)^2 + (y+b)^2
## D -> centerD0

##1.两点距离
Distent <- function(P1,P2){
R = sqrt((P1[1]-P2[1])^2 + (P1[2]-P2[2])^2)
return(R)
}

##2.映射到平行
Trans <- function(P1,P2){
D_s = Distent(P1,P2)
P2=c(P1[1]+D_s,P1[2])
return(P2)
}

##画弧
Cir_D <-function(P1,P2,D=c(0,0),r=1,Space=pi/7){
X = seq(P1[1],P2[1],by=Space)
Y = sqrt(r^2-(X-D[1])^2)+D[2]
S=data.frame(X,Y)
return(S)}


##整合
Connet <- function(P1,P2,Space=pi/7,theta=pi/2){
P3 = Trans(P1,P2)
D=(P1+P3)/2 #中点
d=sqrt((P1-P3)[1]^2 + (P1-P3)[2]^2) #得长
r=(d/2)/sin(theta/2)
l=(d/2)/tan(theta/2)
Cen_x =D[1]
Cen_y = D[2]-l
D=c(Cen_x,Cen_y)
S=Cir_D(P1,P3,D,r,Space=Space)
if(P1[1] -P2[1] > 0){
S$Y = (-1)*S$Y
}
#List = Turn_back(P1,P3,P2)
Sin=(P2-P1)[2]/sqrt(sum((P2-P1)^2))
Cos=(P2-P1)[1]/sqrt(sum((P2-P1)^2))
X = S$X*Cos-S$Y*Sin
Y = S$X*Sin+S$Y*Cos
Line = data.frame(X=X-(X[1]-P1[1]),Y=Y-(Y[1]-P1[2]))
## p <- ggplot(S)+geom_point(aes(X,Y))+
## geom_label(aes(x=P1[1],y=P1[2],label="P1",color="P1"))+
## geom_point(aes(x=P3[1],y=P3[2],color="P3"))+
## geom_point(aes(x=D[1],y=D[2],color="center"))+
## geom_label(aes(x=P2[1],y=P2[2],size=2,label="P2"))+
## geom_point(data=Line,aes(X,Y),color='red')
## print(p)
## p <- geom_point(data=Line,aes(X,Y,group=1),color='red')
return(Line)
}


P1 = c(0,0)
P2 = c(6,0)

Connet(P1,P2)

ggplot(Connet(P1,P2,pi/15),aes(X,Y))+geom_path()

原理:

  • 1.转成平行,方便找圆心
  • 2.画弧(黑色)
  • 3.旋转(红色)

123

Combine The Whole function

##There is a funning thing I found.
##When I try to name it as geom_curve, I cheked the original geom function and find
## THIS FUNCTION EXIST ALREADY!! So, why should I waste so much of time to write this function = =
geom_curve_C <- function(P1,P2,Space=pi/20,theta=pi/2){
P3 = Trans(P1,P2)
D=(P1+P3)/2 #中点
d=sqrt((P1-P3)[1]^2 + (P1-P3)[2]^2) #得长
r=(d/2)/sin(theta/2)
l=(d/2)/tan(theta/2)
Cen_x =D[1]
Cen_y = D[2]-l
D=c(Cen_x,Cen_y)
S=Cir_D(P1,P3,D,r,Space=Space)
if(P1[1] -P2[1] > 0){
S$Y = (-1)*S$Y
}
#List = Turn_back(P1,P3,P2)
Sin=(P2-P1)[2]/sqrt(sum((P2-P1)^2))
Cos=(P2-P1)[1]/sqrt(sum((P2-P1)^2))
X = S$X*Cos-S$Y*Sin
Y = S$X*Sin+S$Y*Cos
Line = data.frame(X=X-(X[1]-P1[1]),Y=Y-(Y[1]-P1[2]))
p <- geom_path(data=Connet(P1,P2,pi/20),aes(x=X,y=Y))
return(p)
}


P1 = c(0,0)
P2 = c(6,0)

ggplot + geom_curve_C(P1,P2)

荧光经纬线

经纬线 <- function(底色='grey',边色="#E9FEFF",Space=30){
p <- ggplot() +
#geom_vline(aes(xintercept=seq(-180,+180,by=Space)),color=颜色,size=1.3,alpha=0.5)+
geom_vline(aes(xintercept=seq(-180,+180,by=Space)),color=边色,size=2,alpha=0.7)+
geom_vline(aes(xintercept=seq(-180,+180,by=Space)),color=底色,linetype="dashed")+
#geom_hline(aes(yintercept=seq(-80,+80,by=Space)),color=颜色,size=1.3,alpha=0.5)+
geom_hline(aes(yintercept=seq(-80,+80,by=Space)),color=边色,size=2,alpha=0.7)+
geom_hline(aes(yintercept=seq(-80,+80,by=Space)),color=底色,linetype="dashed")+
theme_map()
return(p)
}

经纬线()

111

3. theme

文字

theme_text <- function(){
theme(axis.text.x=element_text(angle=45, hjust=1))
}

More

Author

Karobben

Posted on

2020-08-13

Updated on

2024-01-22

Licensed under

Comments