Python Machine Learning

Python Machine Learning

Python Machine Learning

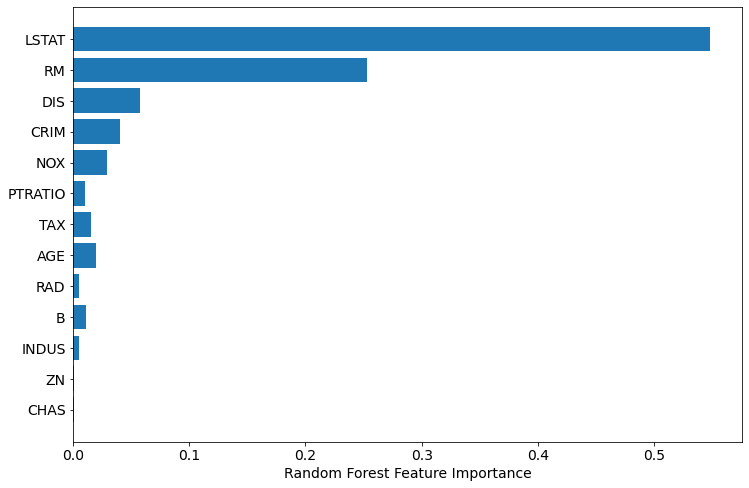
Random Foret Built-in Feature Importance

Row blog is from: Piotr Płoński, 2020

In this practice, we load dataset boston from sklearn.datasets first. All arugments (features) are stored in X and predected results stored in y which is a numpy array. This is the protocol:

  1. load dataset boston from sklearn.datasets.
  2. Split the dataset into tow parts: Train set and Test set.
  3. Run Models
  4. Show results
import numpy as np
import pandas as pd
from sklearn.datasets import load_boston
from sklearn.model_selection import train_test_split
from sklearn.ensemble import RandomForestRegressor
from sklearn.inspection import permutation_importance
import shap
from matplotlib import pyplot as plt

plt.rcParams.update({'figure.figsize': (12.0, 8.0)})
plt.rcParams.update({'font.size': 14})

boston = load_boston()
X = pd.DataFrame(boston.data, columns=boston.feature_names)
y = boston.target
X_train, X_test, y_train, y_test = train_test_split(X, y, test_size=0.25, random_state=12)

rf = RandomForestRegressor(n_estimators=100)
rf.fit(X_train, y_train)

sorted_idx = rf.feature_importances_.argsort()
plt.barh(boston.feature_names[sorted_idx], rf.feature_importances_[sorted_idx])
plt.xlabel("Random Forest Feature Importance")

plt.show()
© Piotr Płoński; 2020

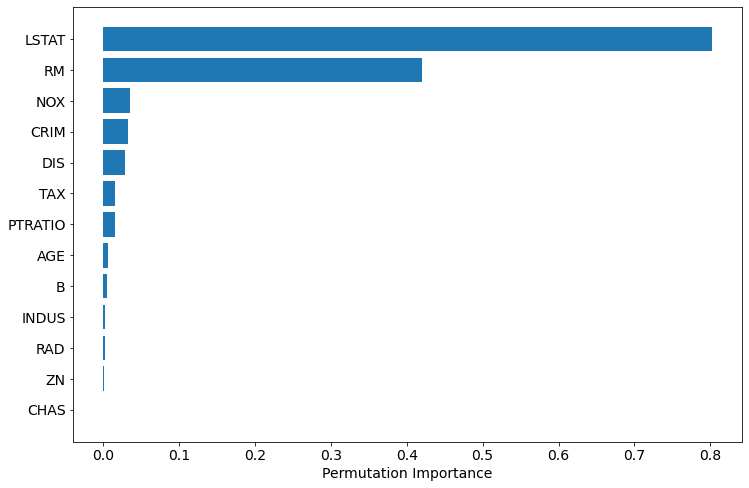
Permutation Based Feature Importance

perm_importance = permutation_importance(rf, X_test, y_test)

sorted_idx = perm_importance.importances_mean.argsort()
plt.barh(boston.feature_names[sorted_idx], perm_importance.importances_mean[sorted_idx])
plt.xlabel("Permutation Importance")
Permutation Based Feature Importance
© Piotr Płoński; 2020

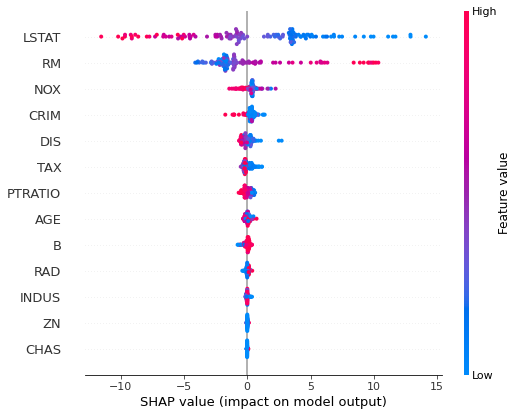
Feature Importance Computed with SHAP Values

explainer = shap.TreeExplainer(rf)
shap_values = explainer.shap_values(X_test)

#shap.summary_plot(shap_values, X_test, plot_type="bar")
shap.summary_plot(shap_values, X_test)
SHAP Values
© Piotr Płoński; 2020

xgboost

Codes
PDF (English)

sudo pip3.7 install -i https://pypi.tuna.tsinghua.edu.cn/simple sklearn
sudo pip3.7 install -i https://pypi.tuna.tsinghua.edu.cn/simple xgboost
from sklearn.datasets import load_iris
import xgboost as xgb
from xgboost import plot_importance
from matplotlib import pyplot as plt
from sklearn.model_selection import train_test_split

## read in the iris data
iris = load_iris()

X = iris.data
y = iris.target

X_train, X_test, y_train, y_test = train_test_split(X, y, test_size=0.2, random_state=1234565)

params = {
'booster': 'gbtree',
'objective': 'multi:softmax',
'num_class': 3,
'gamma': 0.1,
'max_depth': 6,
'lambda': 2,
'subsample': 0.7,
'colsample_bytree': 0.7,
'min_child_weight': 3,
'silent': 1,
'eta': 0.1,
'seed': 1000,
'nthread': 4,
}

plst = params.items()


dtrain = xgb.DMatrix(X_train, y_train)
num_rounds = 500
model = xgb.train(plst, dtrain, num_rounds)

## 对测试集进行预测
dtest = xgb.DMatrix(X_test)
ans = model.predict(dtest)

## 计算准确率
cnt1 = 0
cnt2 = 0
for i in range(len(y_test)):
if ans[i] == y_test[i]:
cnt1 += 1
else:
cnt2 += 1

print("Accuracy: %.2f %% " % (100 * cnt1 / (cnt1 + cnt2)))

## 显示重要特征
plot_importance(model)
plt.show()
Author

Karobben

Posted on

2020-09-12

Updated on

2024-01-11

Licensed under

Comments