Pandas

Pandas

Ignore “Warning” messages

Reference: Bot Bark; 2019

import warnings
warnings.filterwarnings("ignore")

Basic

import pandas as pd

###read file

TB = pd.read_csv("sentence-G",sep='\t', names=None, header=None)
TB.columns = ['频率', '', 'V2', '词义', 'V3']

##DataFrame
pd.DataFrame(index=range(40),columns=['a', 'b'])

### rsult output
TB.to_csv("table",sep='\t')

data
data[0:2] #取前两行数据

len(data ) #求出一共多少行
data.columns.size #求出一共多少列
data.columns #列索引名称
data.index #行索引名称

data.ix[1] #取第2行数据
data.iloc[1] #取第2行数据
data.loc['A'] #取第行索引为”A“的一行数据,
data['x'] #取列索引为x的一列数据

## Most frequent value
data.mode()

## Any True value in this series
data['A'].any()

## All the values are True
data['A'].all()

data.loc[:,['x','z'] ] #表示选取所有的行以及columns为a,b的列;
data.loc[['A','B'],['x','z']] #表示选取'A'和'B'这两行以及columns为x,z的列的并集;
data.iloc[1:3,1:3] #数据切片操作,切连续的数据块
data.iloc[[0,2],[1,2]] #即可以自由选取行位置,和列位置对应的数据,切零散的数据块

data[data>2] #表示选取数据集中大于0的数据
data[data.x>5] #表示选取数据集中x这一列大于5的所有的行
a1=data.copy()
a1[a1['y'].isin(['6','10'])] #表显示满足条件:列y中的值包含'6','8'的所有行。


data.to_excel(r'E:\pypractice\Yun\doc\2.xls',sheet_name='Sheet1') #数据输出至Exceldata[0:2] #取前两行数据

### from Dictionary to DataFrame
TB = pd.Series(BB)

### DataFrame sort
TB = TB.sort_values(ascending=False)


### NaN drap
data.dropna(thresh=3) # at least 3 data we have

Skills

reference: 数据分析1480

NA count

df=pd.read_csv('titanic_train.csv')
def missing_cal(df):
"""
df :数据集
return:每个变量的缺失率
"""
missing_series = df.isnull().sum()/df.shape[0]
missing_df = pd.DataFrame(missing_series).reset_index()
missing_df = missing_df.rename(columns={'index':'col',
0:'missing_pct'})
missing_df = missing_df.sort_values('missing_pct',ascending=False).reset_index(drop=True)
return missing_df
missing_cal(df)

Drop/Fill NA

## Drop the columns or rows by NA value
data.dropna(axis=0)
data.dropna(axis=1)

# drop na with threshold
data.dropna(thresh=3) # at least 3 data we have

## Fill NA value by int

data.fillna(0)
## Fill the NA value by linear interpolation
data.interpolate()

## Fill te NA value with the value ahead or the next
data.fillna(method='ffill')
data.fillna(method='backfill')

idmax

df = pd.DataFrame({'Sp':['a','b','c','d','e','f'], 'Mt':['s1', 's1', 's2','s2','s2','s3'], 'Value':[1,2,3,4,5,6], 'Count':[3,2,5,10,10,6]})
df

df.iloc[df.groupby(['Mt']).apply(lambda x: x['Count'].idxmax())]

df["rank"] = df.groupby("ID")["score"].rank(method="min", ascending=False).astype(np.int64)
df[df["rank"] == 1][["ID", "class"]]

Merging DataFrame

This is one of the most feature I like in pandas since it could automatically fill the missing value with NA.
Plus, when the DataFrame goes huge, pd.concat was way faster than dataframe merge in R.

df = pd.DataFrame({'id_part':['a','b','c','d'], 'pred':[0.1,0.2,0.3,0.4], 'pred_class':['women','man','cat','dog'], 'v_id':['d1','d2','d3','d1']})

## Row
pd.concat([df,df], axis=1)

## Column
pd.concat([df,df])
## or
df.append(df)

Merge by columns

From:

# import pandas as pd
import pandas as pd

# creating dataframes as df1 and df2
df1 = pd.DataFrame({'ID': [1, 2, 3, 5, 7, 8],
'Name': ['Sam', 'John', 'Bridge',
'Edge', 'Joe', 'Hope']})

df2 = pd.DataFrame({'ID': [1, 2, 4, 5, 6, 8, 9],
'Marks': [67, 92, 75, 83, 69, 56, 81]})

df = pd.merge(df1, df2, on="ID", how="left")
print(df)


## multiple columns
new_df = pd.merge(A_df, B_df, how='left', left_on=['A_c1','c2'], right_on = ['B_c1','c2'])

Deleting rows by string-match

df = pd.DataFrame({'a':[1,2,3,4], 'b':['s1', 'exp_s2', 's3','exps4'], 'c':[5,6,7,8], 'd':[3,2,5,10]})
df[df['b'].str.contains('exp')]

Sort

df = pd.DataFrame([['A',1],['A',3],['A',2],['B',5],['B',9]], columns = ['name','score'])

df.sort_values(['name','score'], ascending = [True,False])
df.groupby('name').apply(lambda x: x.sort_values('score', ascending=False)).reset_index(drop=True)

Select columns by features

drinks = pd.read_csv('data/drinks.csv')
## 选择所有数值型的列
drinks.select_dtypes(include=['number']).head()
## 选择所有字符型的列
drinks.select_dtypes(include=['object']).head()
drinks.select_dtypes(include=['number','object','category','datetime']).head()
## 用 exclude 关键字排除指定的数据类型
drinks.select_dtypes(exclude=['number']).head()

str to integer (data type switch)

geeksforgeeks


df.astype(int)

df = pd.DataFrame({'列1':['1.1','2.2','3.3'],
'列2':['4.4','5.5','6.6'],
'列3':['7.7','8.8','-']})

df.astype({'列1':'float','列2':'float'}).dtypes
df = df.apply(pd.to_numeric, errors='coerce').fillna(0)

Reduce the RAM-consume

cols = ['beer_servings','continent']
small_drinks = pd.read_csv('data/drinks.csv', usecols=cols)
dtypes ={'continent':'category'}
smaller_drinks = pd.read_csv('data/drinks.csv',usecols=cols, dtype=dtypes)

根据最大的类别筛选 DataFrame

movies = pd.read_csv('data/imdb_1000.csv')
counts = movies.genre.value_counts()
movies[movies.genre.isin(counts.nlargest(3).index)].head()

split string to columns

df = pd.DataFrame({'姓名':['张 三','李 四','王 五'],
'所在地':['北京-东城区','上海-黄浦区','广州-白云区']})
df
df.姓名.str.split(' ', expand=True)

str.contain

df.['column1'].str.cotain('A')

把 Series 里的列表转换为 DataFrame

df = pd.DataFrame({'列1':['a','b','c'],'列2':[[10,20], [20,30], [30,40]]})

pd.concat([df,df_new], axis='columns')

用多个函数聚合

orders = pd.read_csv('data/chipotle.tsv', sep='\t')
orders.groupby('order_id').item_price.agg(['sum','count']).head()

分组聚合

import pandas as pd
df = pd.DataFrame({'key1':['a', 'a', 'b', 'b', 'a'],
'key2':['one', 'two', 'one', 'two', 'one'],
'data1':np.random.randn(5),
'data2':np.random.randn(5)})
df

for name, group in df.groupby('key1'):
print(name)
print(group)

dict(list(df.groupby('key1')))

通过字典或Series进行分组

people = pd.DataFrame(np.random.randn(5, 5),
columns=['a', 'b', 'c', 'd', 'e'],
index=['Joe', 'Steve', 'Wes', 'Jim', 'Travis'])
mapping = {'a':'red', 'b':'red', 'c':'blue',
'd':'blue', 'e':'red', 'f':'orange'}
by_column = people.groupby(mapping, axis=1)
by_column.sum()

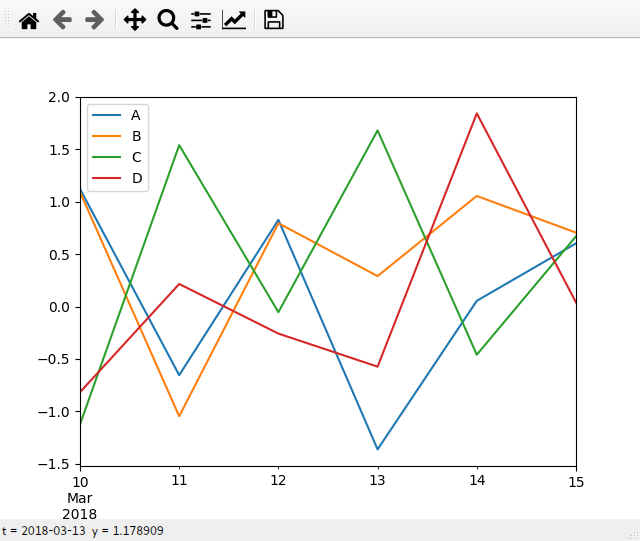
Connect to the matplotlib

import numpy as np
import pandas as pd
from matplotlib import pyplot as plt


dates=pd.date_range('20180310',periods=6)
df = pd.DataFrame(np.random.randn(6,4), index=dates, columns=['A','B','C','D'])
df.plot()
plt.show()

sr7hX4.png

more for plot()

df.hist(column='A', figsize=(4,3))
df.boxplot(column='A', figsize=(4,3))

Data Description: Summary and count

data.mean()           #默认对每一列的数据求平均值;若加上参数a.mean(1)则对每一行求平均值;
data.describe() #对每一列数据进行统计,包括计数,均值,std,各个分位数等。

Count the number of elements in a column

More detials: Erik Marsja; 2020

data['x'].value_counts()    #统计某一列x中各个值出现的次数

Count the number of elelments and convert the result as a DataFrame

jezrael; 2017

df2 = df.value_counts().rename_axis().reset_index()

Read huge file with pandas

  1. check the size of the file:
du -sh test.csv
wc -l test.csv
1.4G	test.csv
17504652 test.csv
  1. Check the normal reading time
import pandas as pd
import time

T_A = time.time()
TB = pd.read_csv('test.csv', sep= ' ')
print(time.time() - T_A)
8.875486135482788

It tacks 8.9s for it read a 1.4GB size file

# Read the file in chunks of 1000 rows
for chunk in pd.read_csv('test.csv', chunksize=1000, sep = ' '):
# Process each chunk of data
print(chunk.shape)

Author

Karobben

Posted on

2020-09-12

Updated on

2023-06-06

Licensed under

Comments