Bubble + Tree plot in GGPLOT| Go plot, KEGG plot© Karobben

Bubble + Tree plot in GGPLOT| Go plot, KEGG plot

An exampel of GO Enrichment

Term DEGs_In_Term PValue Type Up Down Sample Up_ratio Tissue
1 serine-type endopeptidase activity 37 0.0001363367 Molecular Function 15 22 Intestine BSFL10 -0.18918919 Intestine
2 immune response 26 0.0025766225 Biological Process 17 9 Intestine BSFL10 0.30769231 Intestine
3 chemokine receptor activity 9 0.0044977825 Molecular Function 9 0 Intestine BSFL10 1.00000000 Intestine
4 proline dehydrogenase activity 4 0.0305750853 Molecular Function 3 1 Intestine BSFL10 0.50000000 Intestine
5 tumor necrosis factor receptor binding 9 0.0305750853 Molecular Function 6 3 Intestine BSFL10 0.33333333 Intestine
6 extracellular region 85 0.0252513420 Cellular Component 40 45 Intestine BSFL20 -0.05882353 Intestine

libraries

library(ggplot2) # for main graph plot
library(reshape2) # convert the long sheet date to matrix
library(ggdendro) # convert hclust data to segment matrix
library(stringr) # string manipulating

try bubule plot

For focus on plot, I deleted the texts of axis.

head(GO_TB) # the data.frame show above

ggplot(GO_TB, aes(Sample, Term, size = DEGs_In_Term, color =PValue)) +
geom_point() + theme_bw() +
facet_grid(Type ~ Tissue , scales = 'free', space = 'free')+
theme(axis.text = element_blank())
GO Bubble plot

Clust the Dots

# Convert the long sheet to a matrix for calculating the distance.
GO_TB_matrix <- dcast(GO_TB,Term~Sample, value.var = "DEGs_In_Term")
rownames(GO_TB_matrix) <- GO_TB_matrix[["Term"]]
GO_TB_matrix = GO_TB_matrix [,-1]
GO_TB_matrix[is.na(GO_TB_matrix)] = 0

Segement = data.frame()
Label = data.frame()
Num = 0
for( Level in unique(GO_TB$Type)){
GROUP = GO_TB$Term[GO_TB$Type == Level]
hc <- hclust(dist(GO_TB_matrix[row.names(GO_TB_matrix) %in% GROUP,]))
dendr <- dendro_data(hc, type="rectangle") # convert for ggplot
S_tmp <- segment(dendr)
S_tmp$Level <- Level
L_tmp <- label(dendr)
Segement <- rbind(Segement, S_tmp)
Label <- rbind(Label, L_tmp)
}

colnames(Segement)[5] = "Type"

# Synchrony the Levels
GO_TB$Tissue = factor(GO_TB$Tissue, levels = c("hclust", as.character(unique(GO_TB$Tissue) )))
Segement$Tissue = "hclust"

Now, we can plot them together

ggplot() +
geom_point(data= GO_TB, aes(x =Sample, y= Term, size= DEGs_In_Term, color = Up_ratio)) +
facet_grid(Type~Tissue, scales = 'free', switch = "y")+
scale_color_gradient2(high = "salmon",mid = "grey", low = "steelblue", name = "Scaled Up-regulated ratio") + theme_bw() +
theme( strip.text = element_text(face = "bold"),
strip.background = element_rect(colour = "black", fill = FALSE),
axis.text = element_blank(), axis.ticks = element_blank(),
plot.title = element_text(hjust = 0.5),
legend.position = "left") +
labs(title="GO Enrichment", x="Samples", y="Categories", size = "Counts")+
geom_segment(data = Segement, aes(x=-y, y=x, xend=-yend, yend=xend))+
scale_y_discrete(position = "right")

GO bubble tree plot

No facet

Segement_order = data.frame()
Label = data.frame()
Num = 0
for( Level in unique(GO_TB$Type)){
GROUP = GO_TB$Term[GO_TB$Type == Level]
hc <- hclust(dist(GO_TB_matrix[row.names(GO_TB_matrix) %in% GROUP,]))
dendr <- dendro_data(hc, type="rectangle") # convert for ggplot
S_tmp <- segment(dendr)
S_tmp$Level <- Level
L_tmp <- label(dendr)
if(Num >0){
Segement_order$x = Segement_order$x + nrow(L_tmp)
Segement_order$xend = Segement_order$xen + nrow(L_tmp)
Label$x = Label$x + nrow(L_tmp)
}
Segement_order <- rbind(Segement_order, S_tmp)
Label <- rbind(Label, L_tmp)
Num = Num +1
}

Segement_order$label = NA
Segement_order$label[match(Label$x, Segement_order$x)] = as.character(Label$label)
# Segement_order$label = factor(Segement_order$label, levels=Label_order)
Segement_order$Level = factor(Segement_order$Level, levels=unique(Segement_order$Level))

# a matrix for mark the background

Titl_list2 = data.frame()
for(Level in unique(Segement_order$Level)){
Num = Segement_order$x[which(Segement_order$Level == Level)]
Num_max = max(Num)
Num_min = min(Num)
print(Num_max)
tmp <- data.frame(y =(Num_max+Num_min)/2, height = Num_max-Num_min, label= Level)
Titl_list2 = rbind(Titl_list2, tmp)
}


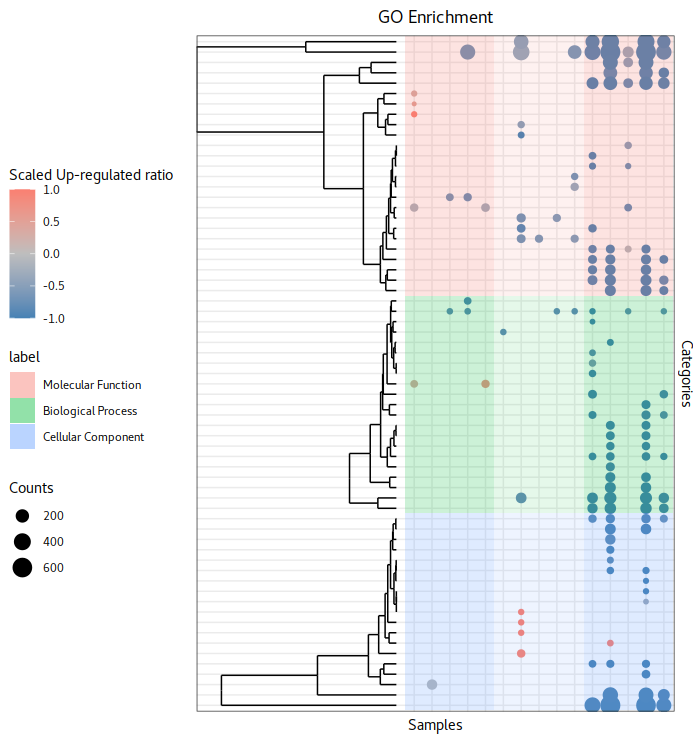
GO_PLOT <- ggplot() +
geom_point(data= GO_TB, aes(x =Sample, y= Term, size= DEGs_In_Term, color = Up_ratio)) +
scale_color_gradient2(high = "salmon",mid = "grey", low = "steelblue", name = "Scaled Up-regulated ratio") + theme_bw() +
theme( strip.text = element_text(face = "bold"),
strip.background = element_rect(colour = "black", fill = FALSE),
axis.text = element_blank(), axis.ticks = element_blank(),
axis.line.x = element_blank(),
plot.title = element_text(hjust = 0.5),
legend.position = "left",
panel.background = element_blank()) +
labs(title="GO Enrichment", x="Samples", y="Categories", size = "Counts")+
geom_segment(data = Segement_order, aes(x=-y/100, y=x, xend=-yend/100, yend=xend))+
scale_y_discrete(position = "right") +
geom_tile(data=Titl_list2, aes(x=3,width = 5, y =y, height = height+1,fill=label), alpha=.2)+
geom_tile(data=Titl_list2, aes(x=8,width = 5, y =y, height = height+1, fill=label), alpha=.1, )+
geom_tile(data=Titl_list2, aes(x=13,width = 5, y =y, height = height+1,fill=label), alpha=.2)

print(GO_PLOT)
GO Bubble Tree plot

Circle it

GO_PLOT + coord_polar(theta = "y", start = 0.1/pi)
GO Bubble Tree circle plot

Bubble + Tree plot in GGPLOT| Go plot, KEGG plot

https://karobben.github.io/2021/04/04/R/ggplot-bubble-tree/

Author

Karobben

Posted on

2021-04-04

Updated on

2023-06-06

Licensed under

Comments