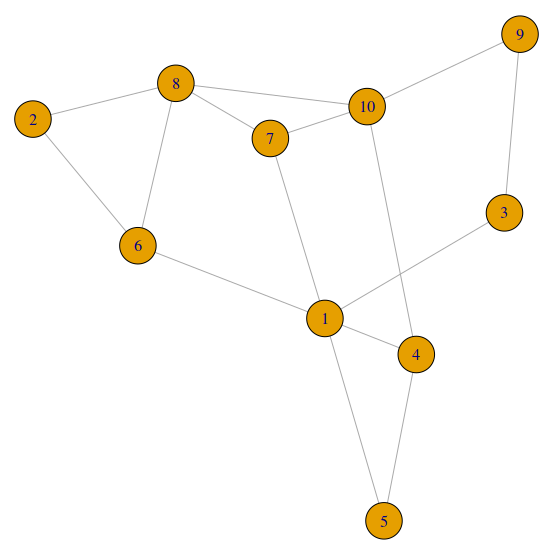
Plot a network
R library(igraph)1 )0 :1 , 100 , replace=TRUE , prob=c (0.8 ,0.2 )), nc=10 )'undirected' , diag=F )c (0 ,0 ,0 ,0 ))
This is the data structure we’d like to have
[,1] [,2] [,3] [,4] [,5] [,6] [,7] [,8] [,9] [,10]
[1,]    0    0    1    0    1    0    1    0    0     0
[2,]    0    0    0    0    0    1    0    1    0     0
[3,]    0    0    0    0    0    0    0    0    0     0
[4,]    1    0    0    0    0    0    0    0    0     1
[5,]    0    0    0    1    0    0    0    0    0     0
[6,]    1    0    0    0    0    0    0    1    0     0
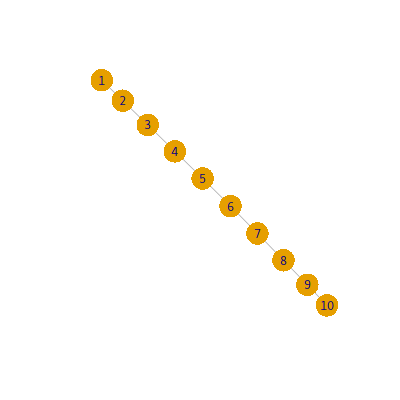
From List to Network-Data Matrix
Let’s say, a list of data 1, 2, 3, 4 means the relationship of 1-> 2 -> 3 -> 4.
R List <- c (1 , 2 , 3 , 4 , 5 , 6 , 7 , 8 , 9 , 10 )function (List){c (List[-1 ],NA )"A" =List, "B" = tmp, V = 0 )c ("A" , "B" , "V" )return (na.omit(TB))function (TB){'A' ,idvar='B' , direction='wide' )c (matrix(t(data.frame(strsplit(colnames(AA),"[.]" )))[,2 ]))1 ]1 ]1 c (colnames(AA), rownames(AA)))is.na (AA)]=0 return (AA)
1 2 3 4 5 6 7 8 9 10
1  0 1 0 0 0 0 0 0 0  0
2  0 0 1 0 0 0 0 0 0  0
3  0 0 0 1 0 0 0 0 0  0
4  0 0 0 0 1 0 0 0 0  0
5  0 0 0 0 0 1 0 0 0  0
6  0 0 0 0 0 0 1 0 0  0
7  0 0 0 0 0 0 0 1 0  0
8  0 0 0 0 0 0 0 0 1  0
9  0 0 0 0 0 0 0 0 0  1
10 0 0 0 0 0 0 0 0 0  0
R network=graph_from_adjacency_matrix(data.matrix(AA), mode='undirected' )"network.png" ,sep="" ), width = 400 , height = 400 )1 ,0.7 ,"" ,"transparent"
© Karobben
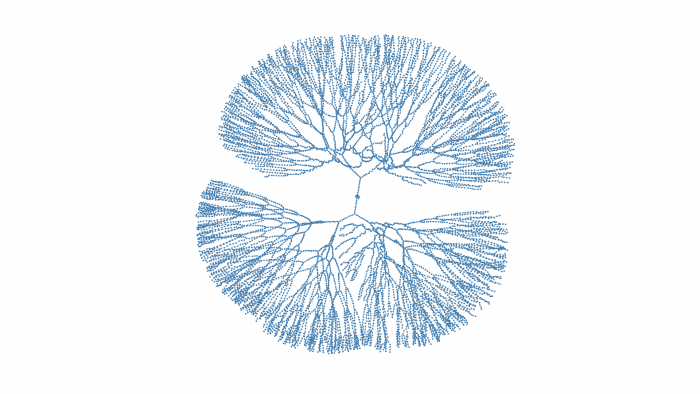
For loop to build a list
Tree_grwoth <- function (Growth_Turn = 10 , Period = 2 ){for (f in c (2 :Growth_Turn)){c ("A" )list ("main" = Main)for (t in c (1 :Turns)){for (branch in names (Result)){c ( Result[[branch]], paste( Result[[branch]][1 ],t, sep="-" ))if (length (branch_tmp) %% Period == 0 ){"New Branch" )length (branch_tmp)]] = c (branch_tmp[length (branch_tmp)])return (Result)20 , 5 )
Length Class  Mode
main     21     -none- character
A-4      17     -none- character
A-4-8    13     -none- character
A-9      12     -none- character
A-4-8-12  9     -none- character
A-4-13    8     -none- character
$main
$main
 [1] "A"    "A-1"  "A-2"  "A-3"  "A-4"  "A-5"  "A-6"  "A-7"  "A-8"  "A-9"  "A-10" "A-11" "A-12" "A-13" "A-14" "A-15"
[17] "A-16" "A-17" "A-18" "A-19" "A-20"
$`A-4`
 [1] "A-4"    "A-4-5"  "A-4-6"  "A-4-7"  "A-4-8"  "A-4-9"  "A-4-10" "A-4-11" "A-4-12" "A-4-13" "A-4-14" "A-4-15"
[13] "A-4-16" "A-4-17" "A-4-18" "A-4-19" "A-4-20"
$`A-4-8`
 [1] "A-4-8"    "A-4-8-9"  "A-4-8-10" "A-4-8-11" "A-4-8-12" "A-4-8-13" "A-4-8-14" "A-4-8-15" "A-4-8-16" "A-4-8-17"
[11] "A-4-8-18" "A-4-8-19" "A-4-8-20"
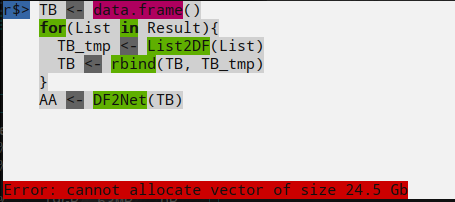
Whole Pipeline
Result <- Tree_grwoth(100 , 10 )'' ' STATE <- data.frame(summary(Result)) STAT <- STATE[STATE$Var2 == "Length",] sum(as.numeric(str_remove_all(as.character(STAT$Freq)," ")) -1) ' '' for (List in Result){'undirected' )1 ,0.7 ,"" ,"transparent"
When I try Result <- Tree_grwoth(135, 10):
V(network)$color ="steelblue" for (i in c (1 :100 )){".png" ,sep="" ), width = 1920 , height = 1080 )1 / tanh (0.004 * i),0.7 ,"" ,"transparent"