Venn Plot in R
ggvenn
Reference: statisticsglobe.com
|
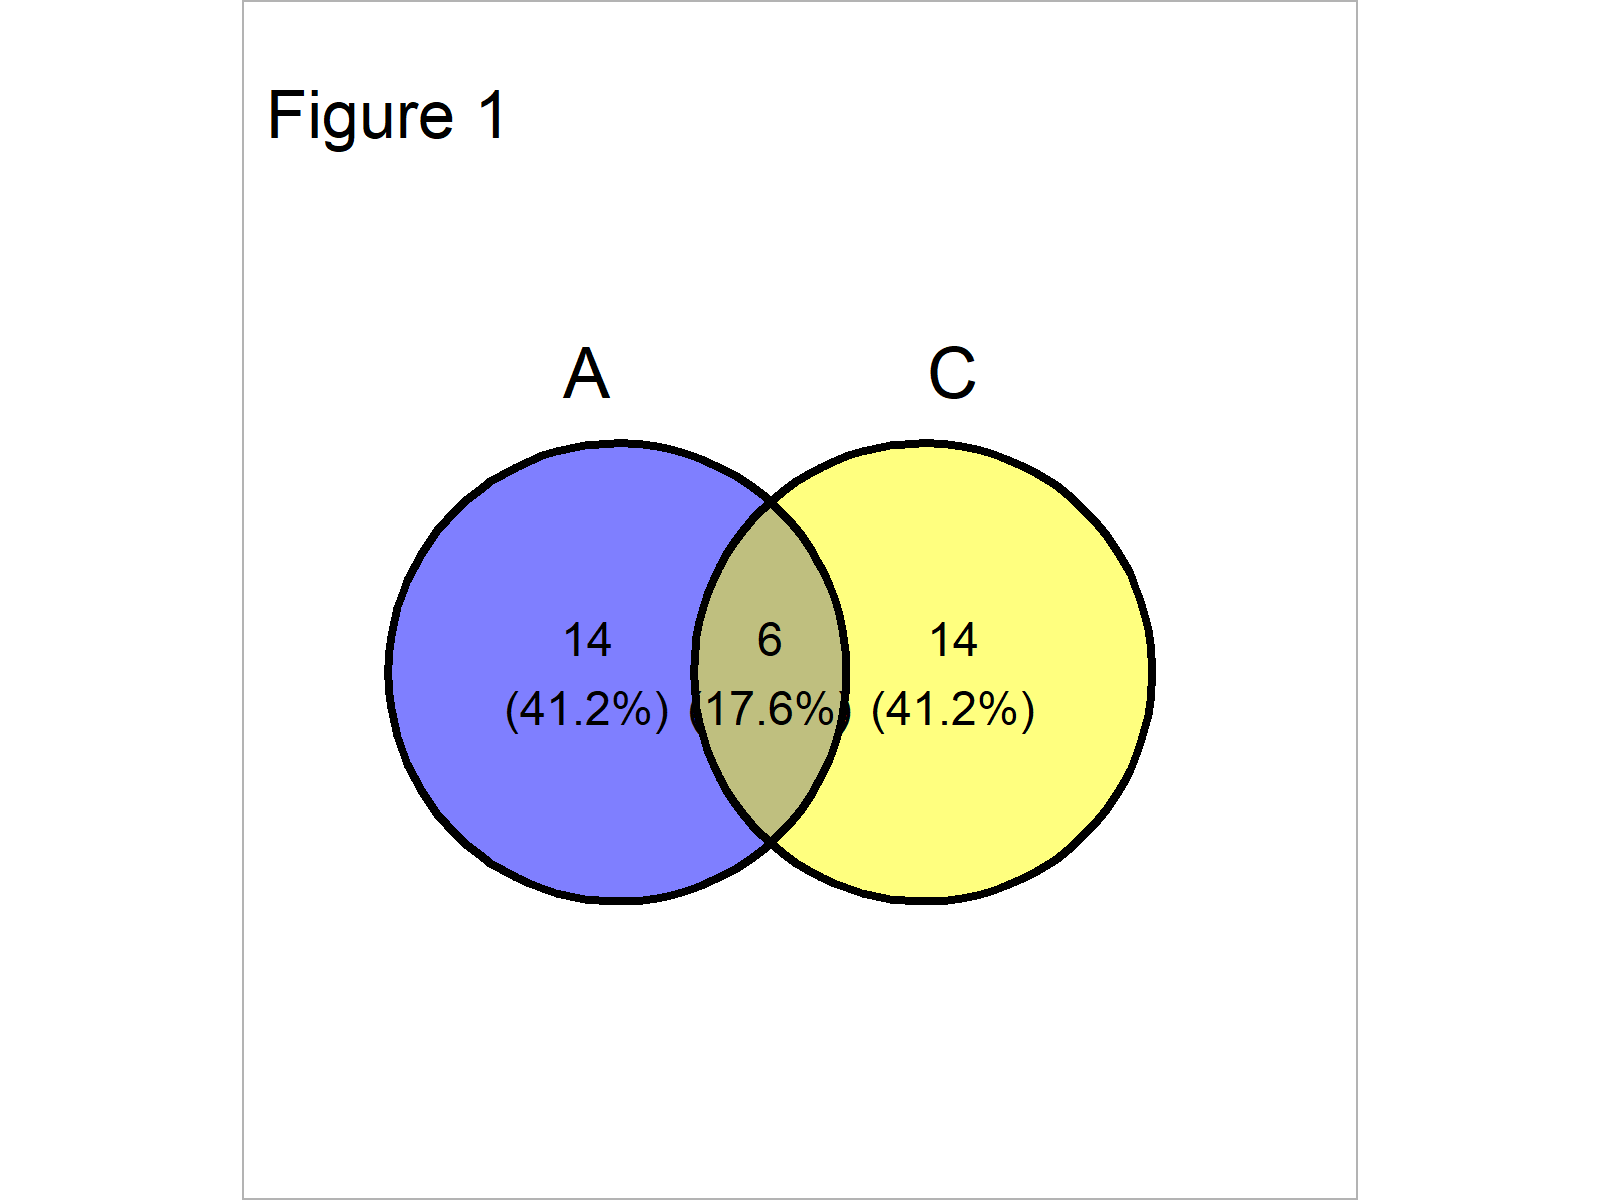
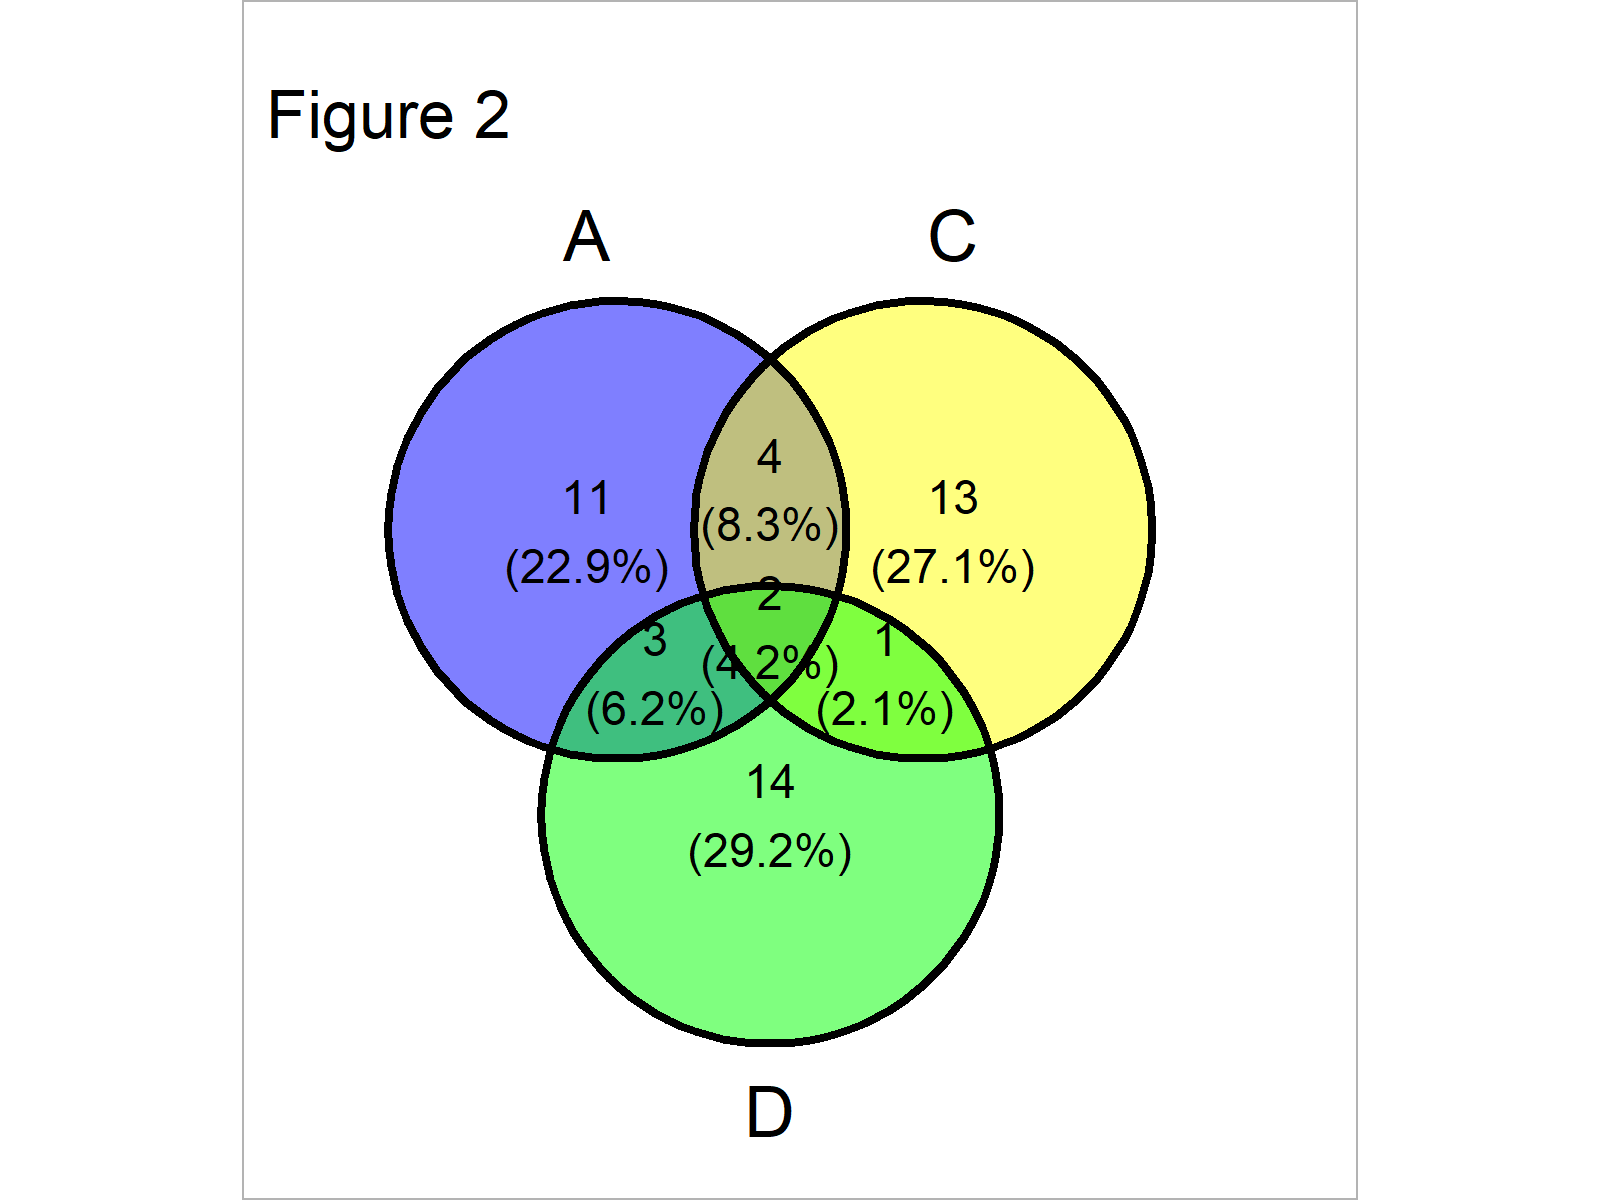
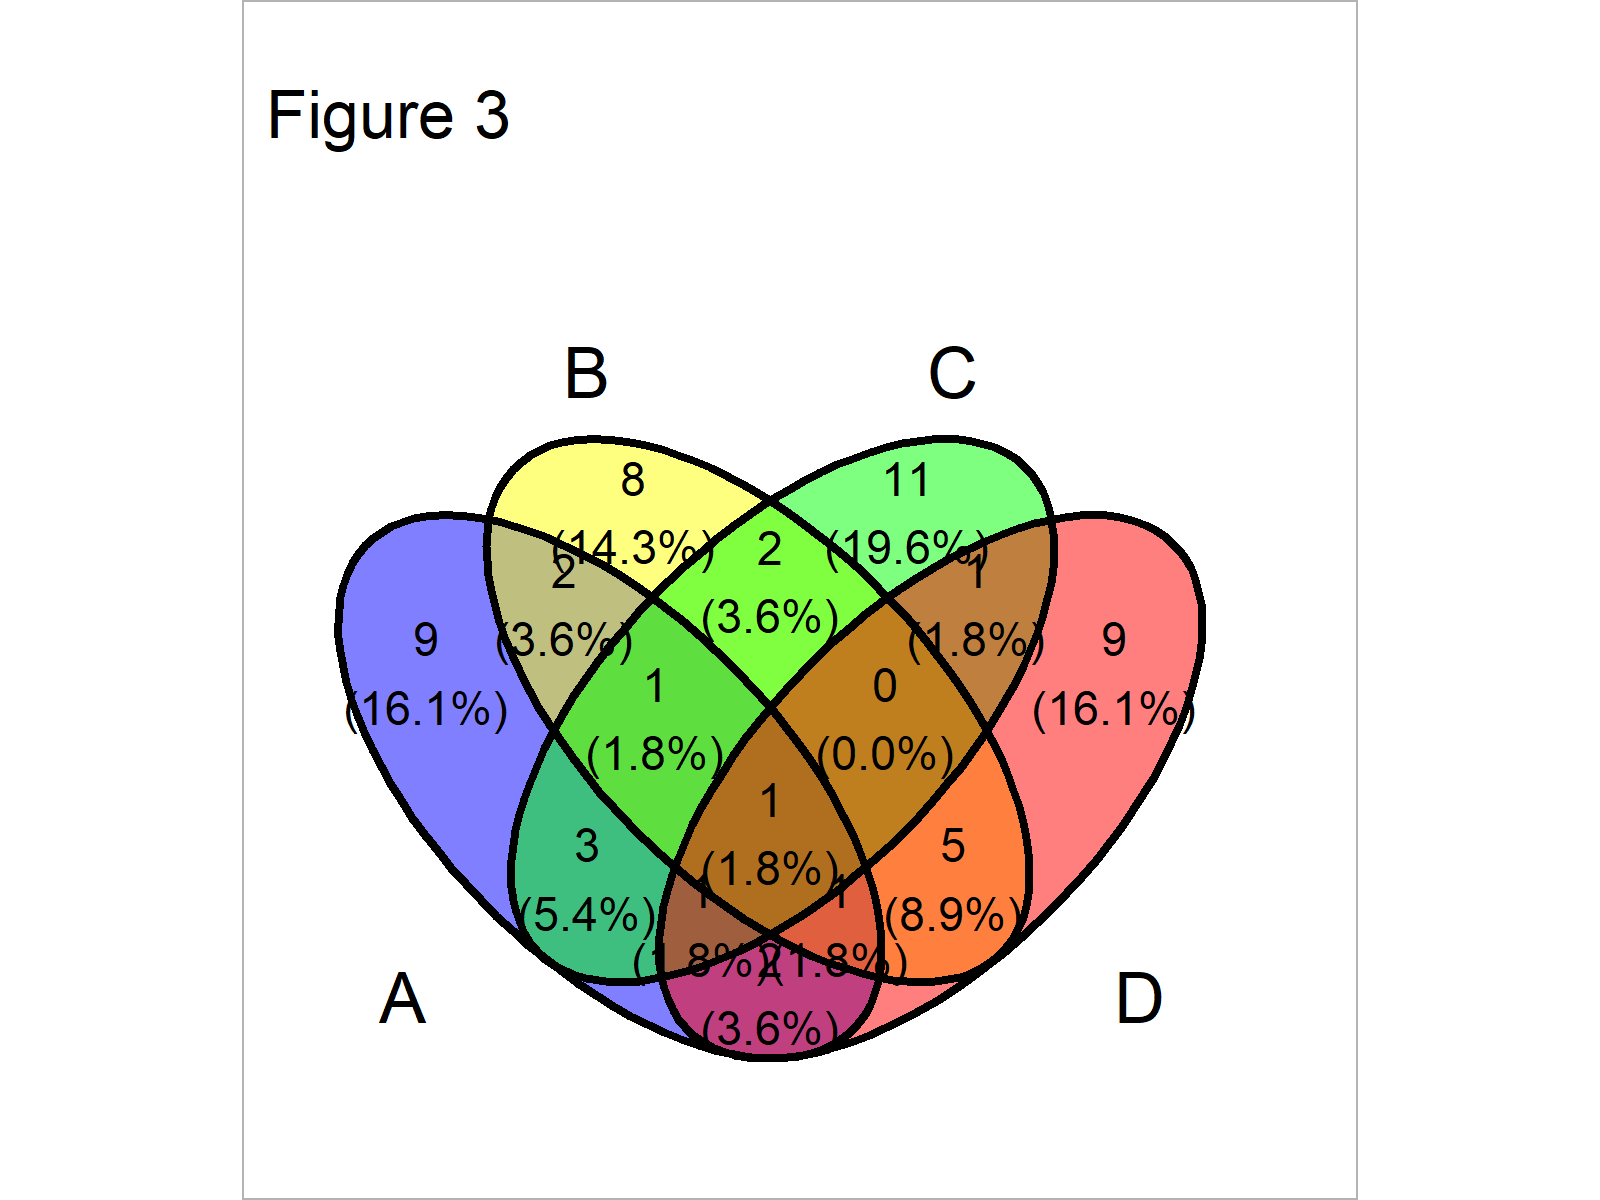
list_venn
$A
[1]  1  3  4 11 19 20 22 32 34 36 47 48 58 59 60 64 69 72 97 98
$B
[1]  4 17 18 23 32 33 34 41 45 52 53 56 58 59 66 67 74 78 91 92
$C
[1]  3 10 28 31 34 38 46 47 51 57 58 65 67 70 72 74 80 89 94 97
$D
[1]  8 11 14 15 17 18 19 33 34 47 51 59 66 68 73 77 78 82 86 87
 |
 |
 |
|---|---|---|
ggvenn(list_venn, c("A", "C")) |
ggvenn(list_venn, c("A", "C", "D")) |
ggvenn(list_venn) |
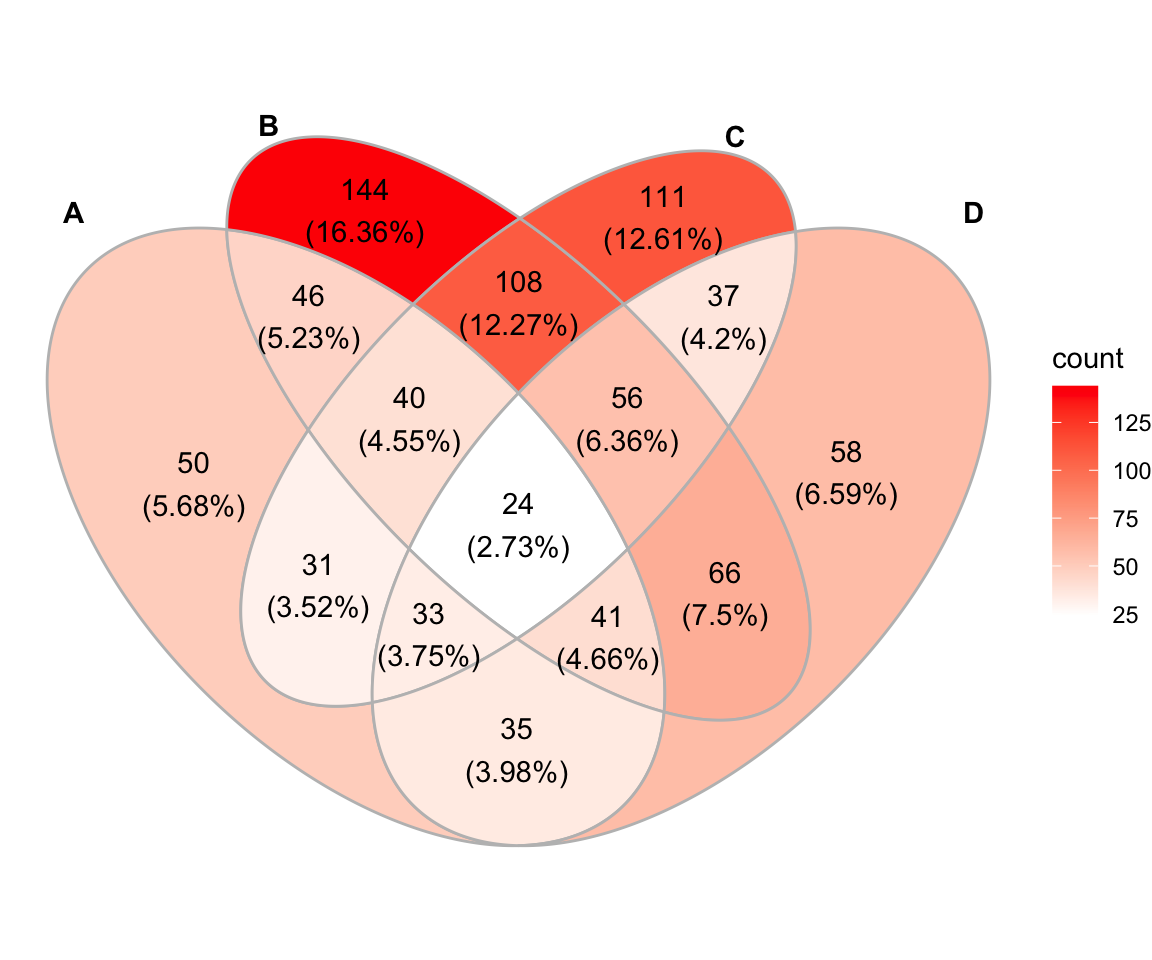
Change the fill color
|
Other related Posts:
Venn Plot in R


