RNA Seq: Alternative Splicing
Please check this update this is a test. lol
Some background
In seminar recording form OHSU Informatics, they talked about how rMATS worked and the limits of rMATS in overlapped genes and complicated splicing events.
Julian
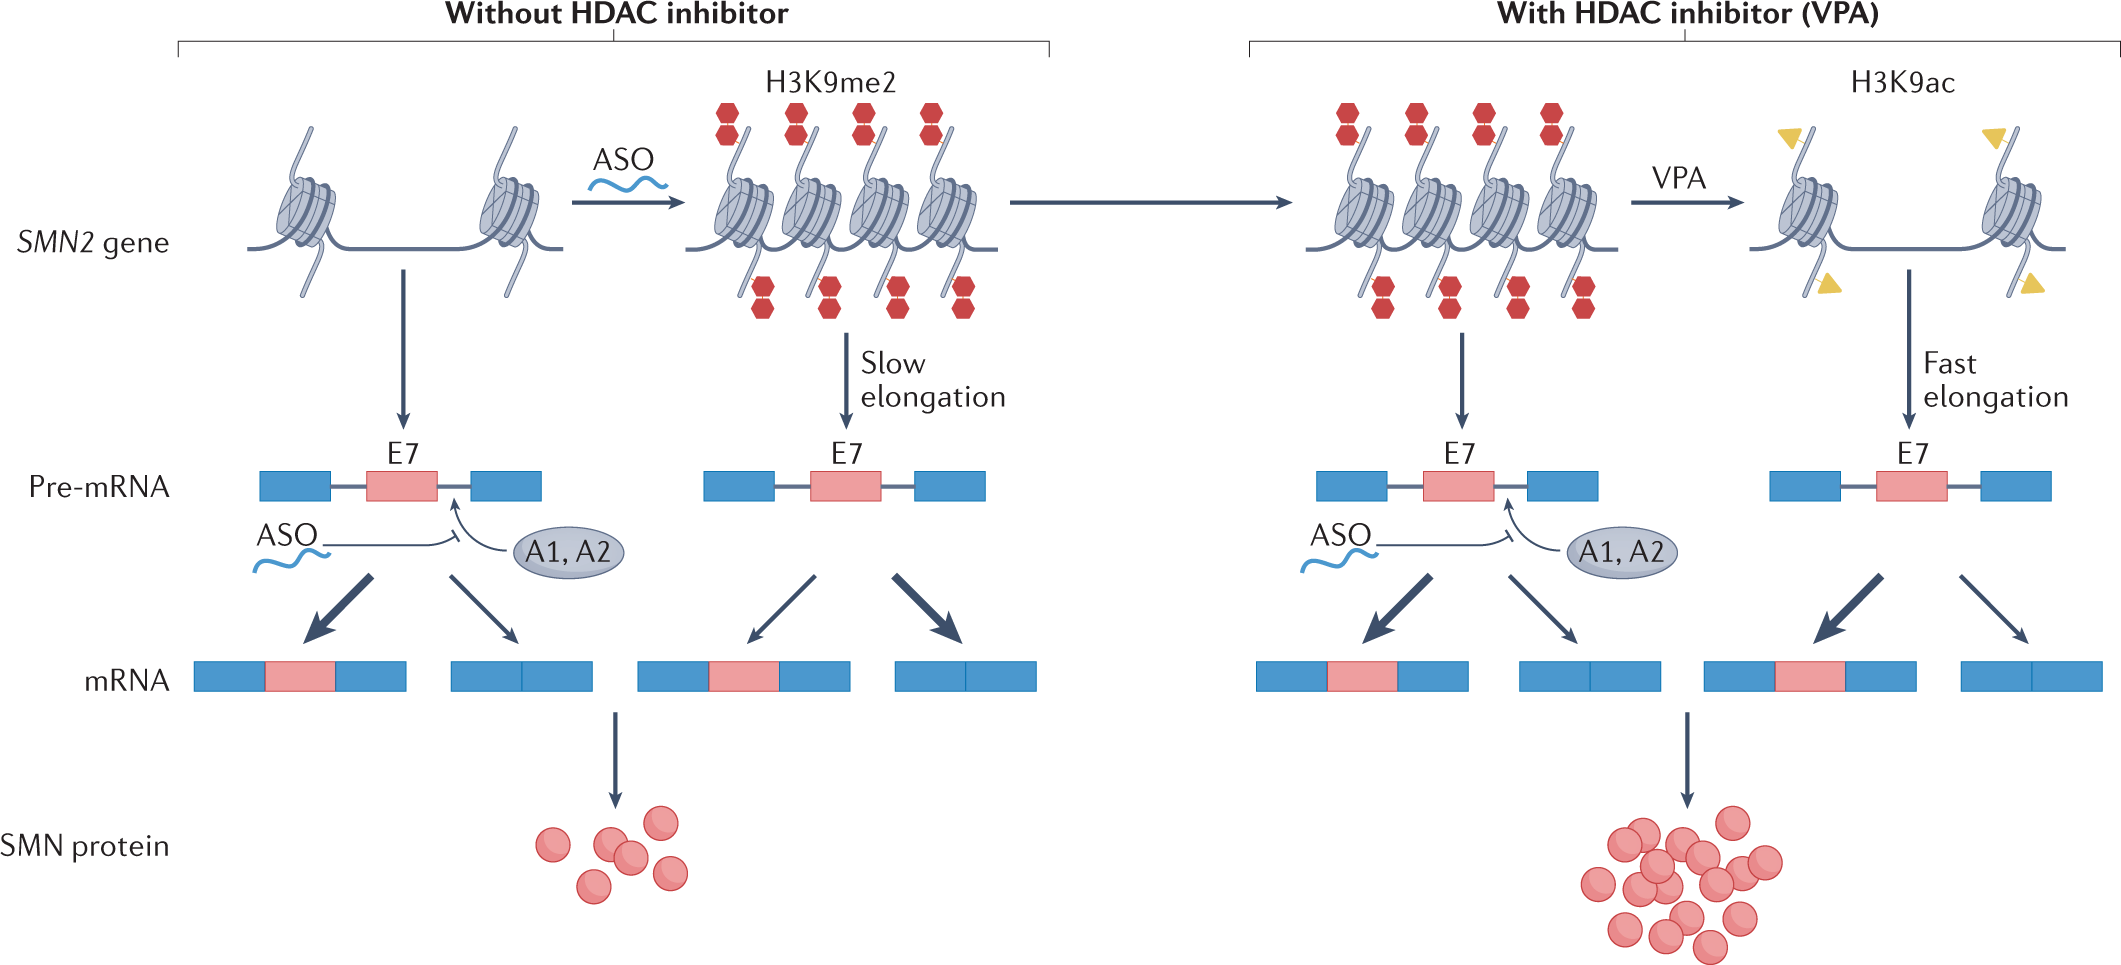
Epigenetics and alternative splicing
Splicing and transcription can be regulated by epigenetic modifications, such as alterations in histone and DNA structures[1][2]. The organization of chromatin can regulate the splicing process by influencing the availability and recruitment of splicing factors[3]. Alternative spoicing could also be affect by histonmadification[4] and DNA modificatiom, like cytosine methylation[5]
Softwares for study alternative splicing
 |
|---|
| © Magdalena J. Koziol, 2018 |
| Tool | Biological Replicates | Model | Experimental Design | Reference |
|---|---|---|---|---|
| JunctionSeq | Yes | Exon & Junction | Design Matrix | [6] |
| Tuxedo 2 | Yes | Isoform, Exon & Junction | Design Matrix | [7] |
| DEXSeq | Yes | Exon | Design Matrix | [8] |
| MATS | No | Exon & Junction | Two Sample | [9] |
| MISO | No | Isoform | Two Sample | [10] |
| Cuffdiff 2 | Yes | Isoform & Exon | Two Groups | [11] |
| DSGseq | Yes | Exon | Two Groups | [12] |
| DiffSplice | Yes | Exon & Junction | Two Groups | [13] |
| ARH-seq | Yes | Exon & Junction | Two Sample | [14] |
rMARS
rMATS (multivariate analysis of transcript splicing ) is a computational tool to detect differential alternative splicing events from RNA-Seq data. The statistical model of MATS calculates the P-value and false discovery rate that the difference in the isoform ratio of a gene between two conditions exceeds a given user-defined threshold. From the RNA-Seq data, MATS can automatically detect and analyze alternative splicing events corresponding to all major types of alternative splicing patterns. MATS handles replicate RNA-Seq data from both paired and unpaired study design. (© Xing Lab)
 |
|---|
| © Xing Lab |
- Unpaired Replicates.
Other Related Tools
MISO, SpliceTrap, ALEXA- seq, and rSeqDiff are designed for two-sample com- parison and do not handle replicates. Cufflinks, FDM, and DiffSplice use the Jensen–Shannon divergence metric to detect differential isoform proportion while accounting for vari- ability among replicates. (rMATS)
Pipelines form the paper
SRS35482: → mapped into Ensembl transcripts (TopHat) → unmapped reads mapped into Genom h1g (TopHat) → rMATS
|
Aligner Choose
For aternative splicing, we have to use intron awareness aligners like tophat, hisat, stat, etc. Other well known aligners like bowtie and bwa should be avoided only you have significant reasons.
Tophat
In the paper of rMATS, they choosed Tophat as the aligner.
You can’t add parameters at the end of the commands. All arguments should following tophat and tha last three is index + reads
|
PS: An interesting thing is you can’t build ‘hisat index’ with ‘gz’ file. So, we need to decompress it before building the index. Lol
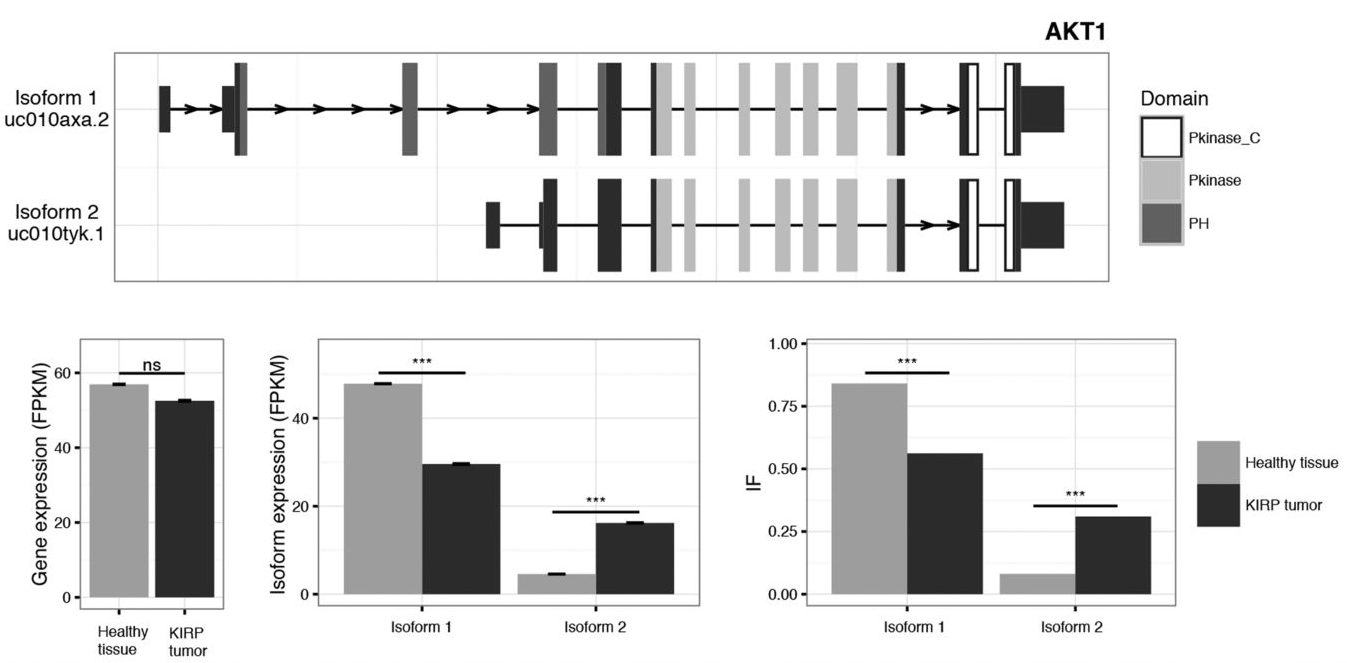
Differential Expression and Differential Splicing.
 |
|---|
| © K. Vitting-Seerup; 2017 |
Run with test data
In the official documentation, they applied a small group of test data:
Thanks for Yunze Liu, I knwo that we just need to download the human gtf for tarting the test.
I tried two set of parameters and the results end the same. But I do have different number of results from genome compared with Yunze Liu’s result which means we used different gtf (Mine has less genes). The reference I used is from ucsc: hg19
GTF and Test data from documentation
.
├── 231ESRP.25K.rep-1.bam
├── 231ESRP.25K.rep-1.bam.bai
├── 231ESRP.25K.rep-1.R1.fastq
├── 231ESRP.25K.rep-1.R2.fastq
├── 231ESRP.25K.rep-2.bam
├── 231ESRP.25K.rep-2.bam.bai
├── 231ESRP.25K.rep-2.R1.fastq
├── 231ESRP.25K.rep-2.R2.fastq
├── 231EV.25K.rep-1.bam
├── 231EV.25K.rep-1.bam.bai
├── 231EV.25K.rep-1.R1.fastq
├── 231EV.25K.rep-1.R2.fastq
├── 231EV.25K.rep-2.bam
├── 231EV.25K.rep-2.bam.bai
├── 231EV.25K.rep-2.R1.fastq
├── 231EV.25K.rep-2.R2.fastq
├── b1.txt
├── b2.txt
├── hg19.ensGene.gtf
├── s1.txt
└── s2.txt
|
Done processing each gene from dictionary to compile AS events
Found 39321 exon skipping events
Found 2115 exon MX events
Found 13456 alt SS events
There are 8337 alt 3 SS events and 5119 alt 5 SS events.
Found 6244 RI events
Repeats and non-repeats results
|
MXE.MATS.JCEC.txt             CFTF    350
MXE.MATS.JCEC.txt             CFTF_s  109
MXE.MATS.JC.txt               CFTF    349
MXE.MATS.JC.txt               CFTF_s  109
RI.MATS.JCEC.txt              CFTF    31
RI.MATS.JCEC.txt              CFTF_s  17
RI.MATS.JC.txt                CFTF    31
RI.MATS.JC.txt                CFTF_s  17
SE.MATS.JCEC.txt              CFTF    857
SE.MATS.JCEC.txt              CFTF_s  334
SE.MATS.JC.txt                CFTF    849
SE.MATS.JC.txt                CFTF_s  333
The first column is rMATS results. the second column is result folder. The last column is the number of row for each file.
CFTF is triplicate result and CFTF_s is single result. We can find that triplicate result have more counts.
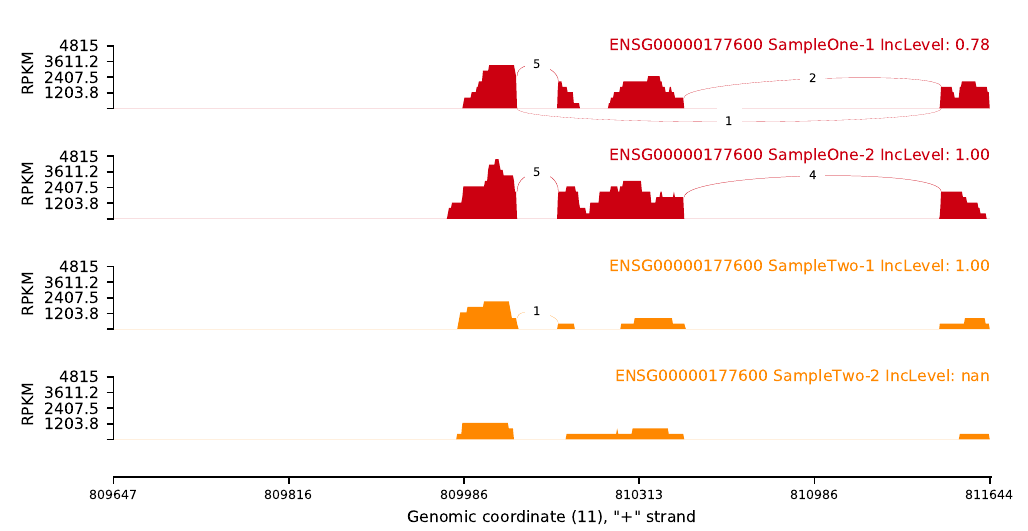
Visualization
Tools: Xinglab/rmats2sashimiplot
This tool is based ob python2, not python3!
Quickies way to install it: conda create --name Splicing -c bioconda rmats2sashimiplot python=2.7
An example of code could be: (Omics-Hunter)
|
 |
|---|
Errors
ImportError: No module named _bsddb
mv: cannot stat '/mnt/cypress/kraken_RNA/asp2/plot/Sashimi_plot/2R:24671294:24688185:+.pdf': No such file or directory
It is because you lack of
|
Plot the result by position
By using the rmats2sashimiplot tool, you can create a plot of the output by specifying a region with the -c option. However, this can be prone to errors. Based on my experience, there are several factors that should be considered:
- It is recommended that each position should have its own directory, as the tool generates an index for that position which may not update even if the parameters are changed.
- It is possible to assign a random position, but it is preferable to assign a position based on the position of exons.
- If there are no genes located within the region that has been specified, an error will occur.
png result
It appears that the rmats2sashimiplot tool is not capable of producing the result as a PNG image format. As a solution, we can use other tools such as pdftoppm to convert the generated PDF file to the PNG format. For instance, a command example to convert a file named p1.pdf to a PNG file named p1.png with a resolution of 1000 can be: pdftoppm p1.pdf p1.png -png -r 1000.
Result Explanation
result
- ES(Exon skipping):外显子跳跃。外显子在前体mRNA剪接形成成熟mRNA过程中被跳过,最终没有出现在某些成熟mRNA上【发生跳跃的外显子和其两侧的内含子都被剪切掉;上游和下游的外显子被直接连着一起保留在剪切后的产物中】
- RI(Retained intron):内含子保留。前体mRNA在剪接形成成熟mRNA的过程中,部分内含子被保留下来【某一段核苷酸序列在一个剪切体中是外显子的一部分,而在与之对照的剪切体中却是内含子而被剪切掉】
- AD(Alternate Donor site)或A5SS(Alternative 5’ splice site):5’端可变剪接。前体mRNA在剪接形成成熟mRNA的过程中,5’端边界发生不同方式的剪接,导致5‘端外显子有所延长
- AA(Alternate acceptor site)或A3SS(Alternative 3’ splice site):3’端可变剪接。前体mRNA在剪接形成成熟mRNA的过程中,3’端边界发生不同方式的剪接,导致3‘端外显子有所延长
- AT(Alternate terminator)或Alternative last exon:第一个外显子发生改变
- AP(Alternate promoter)或Alternative first exon:最后一个外显子发生改变
- ME(Mutually exclusive exon):外显子选择性跳跃。形成的两种不同的转录本中,两转录本之间相同的外显子称为constitutive exon, 不同的外显子称为inclusive exon,inclusive exon不能同时存在与同一转录本中, 只能分别存在于不同转录本中 from: Yunze Liu
An Example of “SE” results
ID	GeneID	geneSymbol	chr	strand	exonStart_0base	exonEnd	upstreamES	upstreamEE	downstreamES	downstreamEE	ID	IJC_SAMPLE_1	SJC_SAMPLE_1	IJC_SAMPLE_2	SJC_SAMPLE_2	IncFormLen	SkipFormLen	PValue	FDR	IncLevel1	IncLevel2	IncLevelDifference
2365	"FBgn0283521"	"lola"	chr2R	-	10515834	10516051	10510524	10511004	10532038	10532119	2365	69,54,77	2,0,6	7,6	3,15	98	49	3.09913051888e-08	6.84584054917e-07	0.945,1.0,0.865	0.538,0.167	0.584
2366	"FBgn0283521"	"lola"	chr2R	-	10527065	10527219	10524804	10525862	10532038	10532119	2366	4,0,9	7,6,7	5,3	0,0	98	49	1.0012167162e-07	2.0676289395e-06	0.222,0.0,0.391	1.0,1.0	-0.796
2341	"FBgn0250823"	"gish"	chr3R	+	16282080	16282408	16274953	16275169	16289630	16289839	2341	400,517,475	57,86,82	33,40	40,43	98	49	0	0.0	0.778,0.75,0.743	0.292,0.317	0.453
2358	"FBgn0250823"	"gish"	chr3R	+	16299590	16299689	16297174	16297345	16301822	16302372	2358	4,8,4	0,0,0	1,0	2,1	98	49	1.12175272649e-06	2.04962226569e-05	1.0,1.0,1.0	0.2,0.0	0.9
2356	"FBgn0250823"	"gish"	chr3R	+	16299590	16299689	16297174	16297345	16300568	16300865	2356	1,0,0	0,1,0	1,0	0,0	98	49	1	1.0	1.0,0.0,NA	1.0,NA	-0.5
2359	"FBgn0250823"	"gish"	chr3R	+	16299590	16299689	16298469	16298550	16301244	16301351	2359	486,567,539	562,650,571	113,125	34,32	98	49	0	0.0	0.302,0.304,0.321	0.624,0.661	-0.334
There are lot’s of columns. Let’s check them one by one.
- ID: A ID for this specific events. Numeric.
- GeneID: The ID of the event-location. Comes from the gtf file you given
- geneSymbol: The name of the genes. ‘lola’ for example.
- chr: chromosome name. It would add a chr at the head of each chromosome’s name. Don’t worry about this feature in
rmats2sashimiplot. You just need the name as the same from gff file. - strand: the direction of the gene.
- exonStart_0base:
Luco RF, Allo M, Schor IE, Kornblihtt AR, Misteli T. 2011 Epigenetics in alternative Pre-mRNA splicing. Cell 144, 16–26. (doi:10.1016/j.cell.2010.11.056) ↩︎
Khan DH, Jahan S, Davie JR. 2012 Pre-mRNA splicing: role of epigenetics and implications in disease. Adv. Biol. Regul. 52, 377–388. (doi:10.1016/j.jbior.2012.04.003) ↩︎
Gunderson FQ, Johnson TL. 2009 Acetylation by the transcriptional coactivator Gcn5 plays a novel role in co-transcriptional spliceosome assembly. PLoS Genet. 5, e1000682. (doi:10.1371/journal.pgen.1000682) ↩︎
Spies N, Nielsen CB, Padgett RA, Burge CB. 2009 Biased chromatin signatures around polyadenylation sites and exons. Mol. Cell 36, 245–254. (doi:10.1016/j.molcel.2009.10.008) ↩︎
Ehrlich M, Ehrlich KC. 2014 DNA cytosine methylation and hydroxymethylation at the borders. Epigenomics 6, 563–566. (doi:10.2217/epi.14.48) ↩︎
Deamer D, Akeson M, Branton D. 2016 Three decades of nanopore sequencing. Nat. Biotechnol. 34, 518–524. (doi:10.1038/nbt.3423) ↩︎
Blake JA et al. 2015 Gene ontology consortium: going forward. Nucleic Acids Res. 43, D1049–D1056. (doi:10.1093/nar/gku1179) ↩︎
Le Nove`re N. 2015 Quantitative and logic modelling of molecular and gene networks. Nat. Rev. Genet. 16, 146–158. (doi:10.1038/nrg3885) ↩︎
Fisher J, Henzinger TA. 2007 Executable cell biology. Nat. Biotechnol. 25, 1239–1249. (doi:10.1038/nbt1356) ↩︎
Markowetz F. 2010 How to understand the cell by breaking it: network analysis of gene perturbation screens. PLoS Comput. Biol. 6, e1000655. (doi:10. 1371/journal.pcbi.1000655) ↩︎
Bellman RE. 1957 Dynamic programming. Princeton, NJ: Princeton University Press. ↩︎
Robinson MD, McCarthy DJ, Smyth GK. 2010 edgeR: a Bioconductor package for differential expression analysis of digital gene expression data. Bioinformatics 26, 139–140. (doi:10.1093/ bioinformatics/btp616) ↩︎
Gao D, Kim J, Kim H, Phang TL, Selby H, Tan AC, Tong T. 2010 A survey of statistical software for analysing RNA-seq data. Hum. Genomics 5, 56–60. (doi:10.1186/1479-7364-5-1-56) ↩︎
Kitano H. 2002 Systems biology: a brief overview. Science 295, 1662–1664. (doi:10.1126/science.1069492) ↩︎
RNA Seq: Alternative Splicing
https://karobben.github.io/2022/11/07/Bioinfor/alternative-splicing/


