Overlap calculation in R
overlap
overlap: The overlap package provides functions to calculate and visualize the overlap of two or more density distributions. The overlapEst function can be used to calculate the overlap of two density distributions, while the overlapPlot function can be used to visualize the overlap.
|
    Dhat1     Dhat4     Dhat5
0.2460298        NA        NA
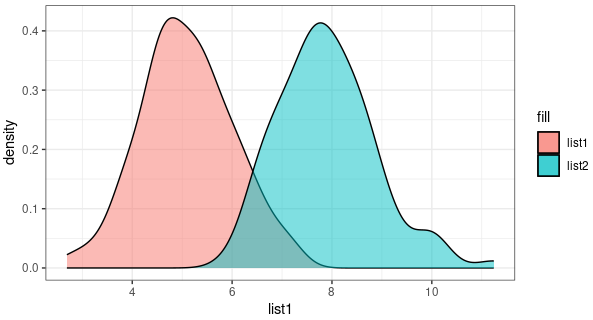
overlapping
|
$OV
[1] 0.1431085
I personally believe that this result is more reliable.
Overlap calculation in R


