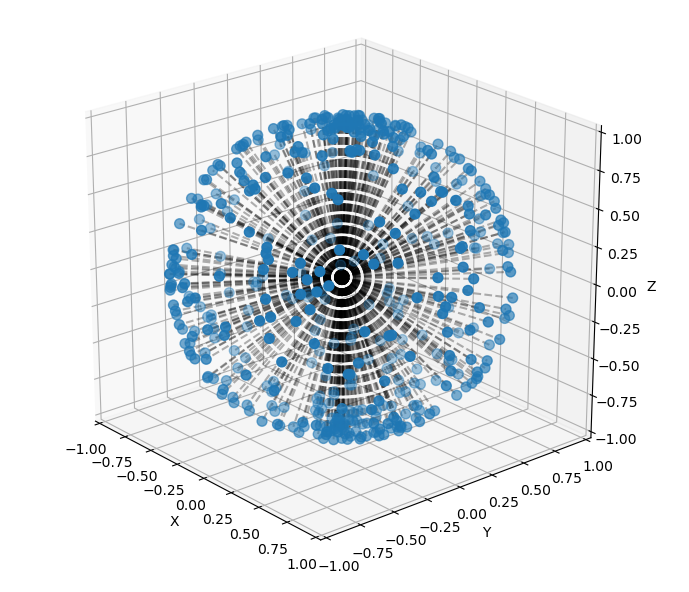
Python 3D Plot© Karobben

Python 3D Plot

Plot a ball

import numpy as np
import matplotlib.pyplot as plt
from mpl_toolkits.mplot3d import Axes3D

# Generate random points on the surface of a unit sphere
np.random.seed(123)
n_points = 500
theta = np.random.uniform(0, 2 * np.pi, size=n_points)
phi = np.random.uniform(0, np.pi, size=n_points)
x = np.sin(phi) * np.cos(theta)
y = np.sin(phi) * np.sin(theta)
z = np.cos(phi)

# Plot the points on a 3D scatter plot
fig = plt.figure()
ax = fig.add_subplot(111, projection='3d')
ax.scatter(x, y, z, s=50)

# Connect the dots to the center of the ball
center = np.array([0, 0, 0])
for i in range(n_points):
point = np.array([x[i], y[i], z[i]])
ax.plot([center[0], point[0]], [center[1], point[1]], [center[2], point[2]], 'k--', alpha=0.3)

# Set axis limits and labels
ax.set_xlim([-1, 1])
ax.set_ylim([-1, 1])
ax.set_zlim([-1, 1])
ax.set_xlabel('X')
ax.set_ylabel('Y')
ax.set_zlabel('Z')
plt.show()

In this code, we first generate random points on the surface of a unit sphere using the numpy.random.uniform function. Then we plot these points on a 3D scatter plot using matplotlib. Finally, we connect each point to the center of the sphere using a black dotted line with ax.plot. The center of the sphere is defined as [0, 0, 0].

3D ball shape dots plot

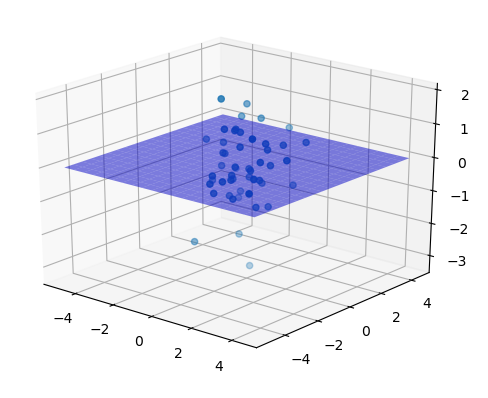
Add a plate to slice the dots

how to plot a surface

import numpy as np
import matplotlib.pyplot as plt
from mpl_toolkits.mplot3d import Axes3D

fig = plt.figure()
ax = fig.add_subplot(111, projection='3d')

# Generate some data for the plot
x, y = np.meshgrid(np.arange(-5, 5, 0.5), np.arange(-5, 5, 0.5))
z = np.zeros(x.shape)

# Create the plane surface
ax.plot_surface(x, y, z, alpha=0.5, color='blue')

# Plot some 3D points
xs = np.random.normal(size=50)
ys = np.random.normal(size=50)
zs = np.random.normal(size=50)

ax.scatter(xs, ys, zs)

plt.show()

In this code, we first create a figure and a subplot with a 3D projection. Then, we generate some data for the surface plane using numpy.meshgrid(). We set the z values to zero so that the plane is on the xy plane.

We then create the plane surface using Axes3D.plot_surface() function. The alpha parameter sets the transparency of the surface and the color parameter sets its color.

Finally, we plot some 3D points using the Axes3D.scatter() function.

When you run this code, you should see a 3D plot with a transparent blue plane surface and some randomly scattered 3D points.

Python: A surface in 3D plot

Slice the ball with the surface

import numpy as np
import matplotlib.pyplot as plt
from mpl_toolkits.mplot3d import Axes3D

# Generate random points on the surface of a unit sphere
np.random.seed(123)
n_points = 500
theta = np.random.uniform(0, 2 * np.pi, size=n_points)
phi = np.random.uniform(0, np.pi, size=n_points)
x = np.sin(phi) * np.cos(theta)
y = np.sin(phi) * np.sin(theta)
z = np.cos(phi)

# Plot the points on a 3D scatter plot
fig = plt.figure()
ax = fig.add_subplot(111, projection='3d')
ax.scatter(x, y, z, s=50)

# Connect the dots to the center of the ball
center = np.array([0, 0, 0])
for i in range(n_points):
point = np.array([x[i], y[i], z[i]])
ax.plot([center[0], point[0]], [center[1], point[1]], [center[2], point[2]], 'k--', alpha=0.3)

# Set axis limits and labels
ax.set_xlim([-1, 1])
ax.set_ylim([-1, 1])
ax.set_zlim([-1, 1])
ax.set_xlabel('X')
ax.set_ylabel('Y')
ax.set_zlabel('Z')

# Add plate

x, y = np.meshgrid(np.arange(-1, 1.5, 0.5),
np.arange(-1, 1.5, 0.5))
z = np.zeros(x.shape)

# Create the plane surface
ax.plot_surface(x, y, z + .7, alpha=0.5, color='steelblue')
ax.plot_surface(x, y, z +.75, alpha=0.5, color='red')
ax.plot_surface(x, y, z + .8, alpha=0.5, color='steelblue')


plt.show()

Python 3D plot: slice a ball with plate

Author

Karobben

Posted on

2023-03-07

Updated on

2023-06-06

Licensed under

Comments