WGCNA Tutorial 1

WGCNA Tutorial 1

WGCNA Tutorial 1

raw tutorial: Peter

Data:

1. Data Cleaning

## Load the WGCNA package
library(WGCNA);
## The following setting is important, do not omit.
options(stringsAsFactors = FALSE);
##Read in the female liver data set
femData = read.csv("LiverFemale3600.csv");

datExpr0 = as.data.frame(t(femData[, -c(1:8)]));
names(datExpr0) = femData$substanceBXH;
rownames(datExpr0) = names(femData)[-c(1:8)];

1.1 Checking data

Checking data for excessive missing values and identification of outlier microarray samples

gsg = goodSamplesGenes(datExpr0, verbose = 3);
gsg$allOK


if (!gsg$allOK)
{
# Optionally, print the gene and sample names that were removed:
if (sum(!gsg$goodGenes)>0)
printFlush(paste("Removing genes:", paste(names(datExpr0)[!gsg$goodGenes], collapse = ", ")));
if (sum(!gsg$goodSamples)>0)
printFlush(paste("Removing samples:", paste(rownames(datExpr0)[!gsg$goodSamples], collapse = ", ")));
# Remove the offending genes and samples from the data:
datExpr0 = datExpr0[gsg$goodSamples, gsg$goodGenes]
}

1.2 Cluster the samples

sampleTree = hclust(dist(datExpr0), method = "average");
## Plot the sample tree: Open a graphic output window of size 12 by 9 inches
## The user should change the dimensions if the window is too large or too small.
sizeGrWindow(12,9)
##png(file = "sampleClustering.png")
par(cex = 0.6);
par(mar = c(0,4,2,0))
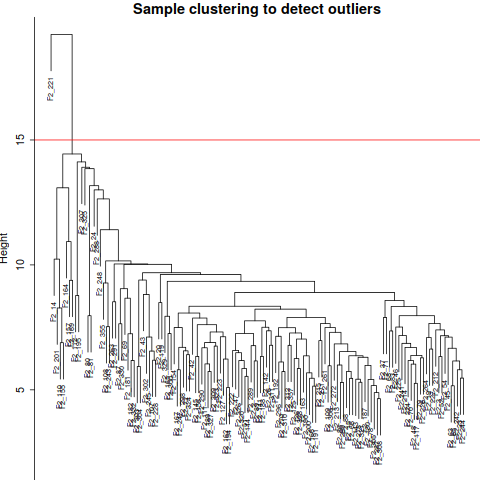
plot(sampleTree, main = "Sample clustering to detect outliers", sub="", xlab="", cex.lab = 1.5,
cex.axis = 1.5, cex.main = 2)

## Plot a line to show the cut
abline(h = 15, col = "red")

sampleClustering

It appears there is one outlier (sample F2_221, see Fig. 1). One can remove it by hand, or use an automatic approach. Choose a height cut that will remove the offending sample, say 15 (the red line in the plot), and use a branch cut at that height.

1.3 Remove the abnormal sample

## Determine cluster under the line
clust = cutreeStatic(sampleTree, cutHeight = 15, minSize = 10)
table(clust)
## clust 1 contains the samples we want to keep.
keepSamples = (clust==1)
datExpr = datExpr0[keepSamples, ]
nGenes = ncol(datExpr)
nSamples = nrow(datExpr)

1.4 Loading Clinical Data

traitData = read.csv("ClinicalTraits.csv");
dim(traitData)
names(traitData)

## remove columns that hold information we do not need.
allTraits = traitData[, -c(31, 16)];
allTraits = allTraits[, c(2, 11:36) ];
dim(allTraits)
names(allTraits)

## Form a data frame analogous to expression data that will hold the clinical traits.

femaleSamples = rownames(datExpr);
traitRows = match(femaleSamples, allTraits$Mice);
datTraits = allTraits[traitRows, -1];
rownames(datTraits) = allTraits[traitRows, 1];

collectGarbage()

## Re-cluster samples
sampleTree2 = hclust(dist(datExpr), method = "average")
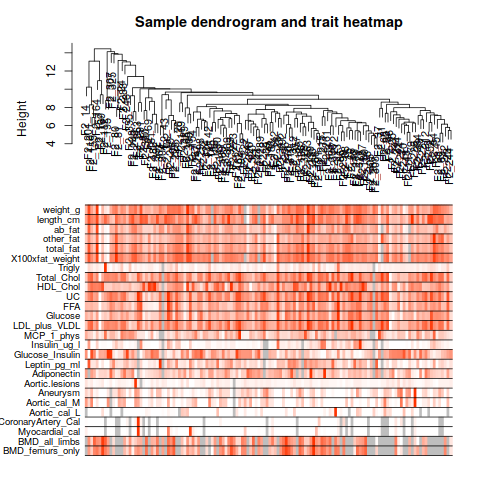
## Convert traits to a color representation: white means low, red means high, grey means missing entry
traitColors = numbers2colors(datTraits, signed = FALSE);
## Plot the sample dendrogram and the colors underneath.
## png("traits_heatmap.png")
plotDendroAndColors(sampleTree2, traitColors,
groupLabels = names(datTraits),
main = "Sample dendrogram and trait heatmap")

traits_heatmap

2. Network construction and module detection

Automatic one-step detection

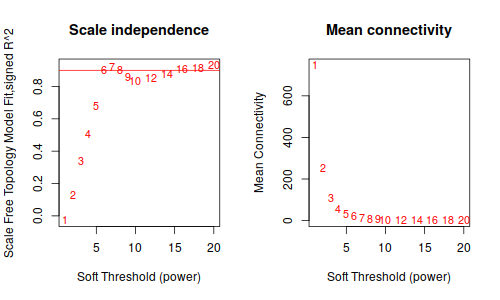
2.1 Pick soft-thresdholding power

## Choose a set of soft-thresholding powers
powers = c(c(1:10), seq(from = 12, to=20, by=2))
## Call the network topology analysis function
sft = pickSoftThreshold(datExpr, powerVector = powers, verbose = 5)
## Plot the results:
sizeGrWindow(9, 5)
## Scale-free topology fit index as a function of the soft-thresholding power
## png("Soft_th.png",width=500,height=300)
cex1 = 0.9;
par(mfrow = c(1,2));
plot(sft$fitIndices[,1], -sign(sft$fitIndices[,3])*sft$fitIndices[,2],
xlab="Soft Threshold (power)",ylab="Scale Free Topology Model Fit,signed R^2",type="n",
main = paste("Scale independence"));
text(sft$fitIndices[,1], -sign(sft$fitIndices[,3])*sft$fitIndices[,2],
labels=powers,cex=cex1,col="red");
## this line corresponds to using an R^2 cut-off of h
abline(h=0.90,col="red")
## Mean connectivity as a function of the soft-thresholding power
plot(sft$fitIndices[,1], sft$fitIndices[,5],
xlab="Soft Threshold (power)",ylab="Mean Connectivity", type="n",
main = paste("Mean connectivity"))
text(sft$fitIndices[,1], sft$fitIndices[,5], labels=powers, cex=cex1,col="red")

Soft_th

2.2 One-step network construction and module detection

net = blockwiseModules(datExpr, power = 6,
TOMType = "unsigned", minModuleSize = 30,
reassignThreshold = 0, mergeCutHeight = 0.25,
numericLabels = TRUE, pamRespectsDendro = FALSE,
saveTOMs = TRUE,
saveTOMFileBase = "femaleMouseTOM",
verbose = 3)

## View modules
## table(net$colors)
moduleLabels = net$colors
moduleColors = labels2colors(net$colors)
MEs = net$MEs;
geneTree = net$dendrograms[[1]]
## open a graphics window
sizeGrWindow(12, 9)
## png('123.png',width=480, height=320)
## Convert labels to colors for plotting
mergedColors = labels2colors(net$colors)
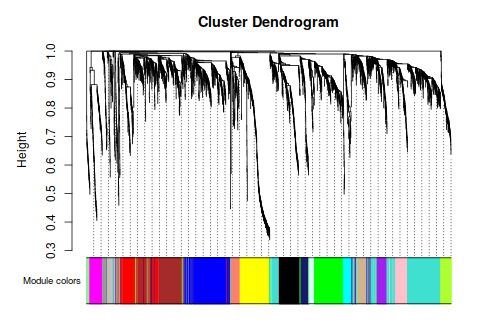
## Plot the dendrogram and the module colors underneath
plotDendroAndColors(net$dendrograms[[1]], mergedColors[net$blockGenes[[1]]],
"Module colors",
dendroLabels = FALSE, hang = 0.03,
addGuide = TRUE, guideHang = 0.05)

123

3. Relating modules to external information and identifying important genes

3.1 Clinical Traits

## Define numbers of genes and samples
nGenes = ncol(datExpr);
nSamples = nrow(datExpr);
## Recalculate MEs with color labels
MEs0 = moduleEigengenes(datExpr, moduleColors)$eigengenes
MEs = orderMEs(MEs0)
moduleTraitCor = cor(MEs, datTraits, use = "p");
moduleTraitPvalue = corPvalueStudent(moduleTraitCor, nSamples);


sizeGrWindow(10,6)
## Will display correlations and their p-values
## png("1234.png",width=1000,height=600)
textMatrix = paste(signif(moduleTraitCor, 2), "\n(",
signif(moduleTraitPvalue, 1), ")", sep = "");
dim(textMatrix) = dim(moduleTraitCor)
par(mar = c(6, 8.5, 3, 3));
## Display the correlation values within a heatmap plot
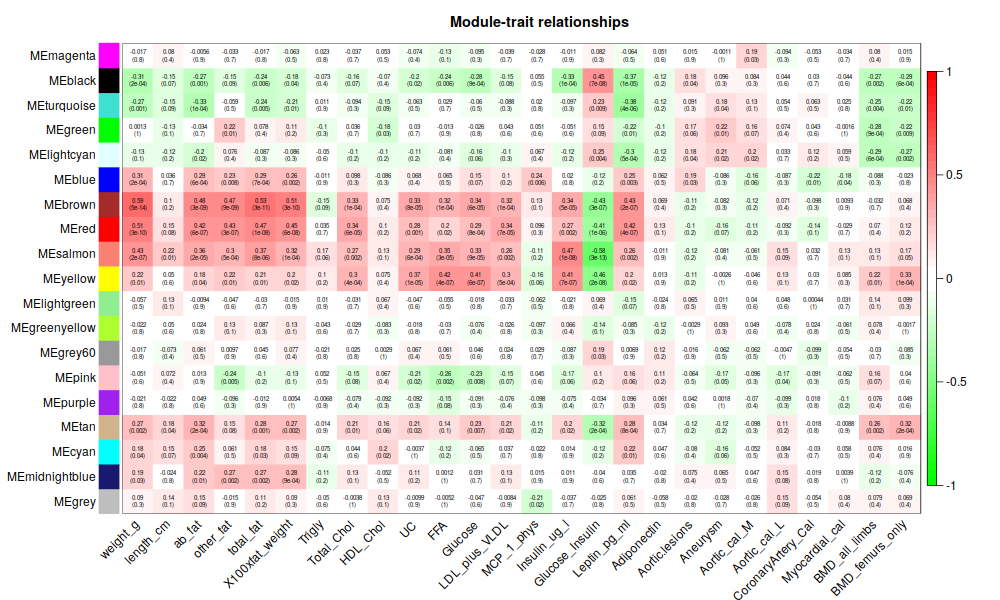
labeledHeatmap(Matrix = moduleTraitCor,
xLabels = names(datTraits),
yLabels = names(MEs),
ySymbols = names(MEs),
colorLabels = FALSE,
colors = greenWhiteRed(50),
textMatrix = textMatrix,
setStdMargins = FALSE,
cex.text = 0.5,
zlim = c(-1,1),
main = paste("Module-trait relationships"))

1234

3.2 Genes and Trait

## Define variable weight containing the weight column of datTrait
weight = as.data.frame(datTraits$weight_g);
names(weight) = "weight"
## names (colors) of the modules
modNames = substring(names(MEs), 3)

geneModuleMembership = as.data.frame(cor(datExpr, MEs, use = "p"));
MMPvalue = as.data.frame(corPvalueStudent(as.matrix(geneModuleMembership), nSamples));

names(geneModuleMembership) = paste("MM", modNames, sep="");
names(MMPvalue) = paste("p.MM", modNames, sep="");

geneTraitSignificance = as.data.frame(cor(datExpr, weight, use = "p"));
GSPvalue = as.data.frame(corPvalueStudent(as.matrix(geneTraitSignificance), nSamples));

names(geneTraitSignificance) = paste("GS.", names(weight), sep="");
names(GSPvalue) = paste("p.GS.", names(weight), sep="");


module = "brown"
column = match(module, modNames);
moduleGenes = moduleColors==module;

sizeGrWindow(7, 7);
## png("1234.png")
par(mfrow = c(1,1));
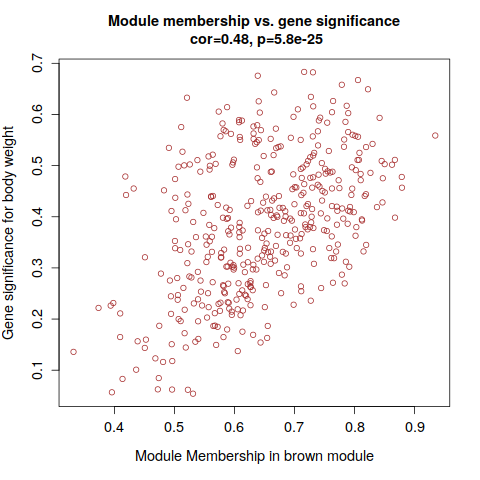
verboseScatterplot(abs(geneModuleMembership[moduleGenes, column]),
abs(geneTraitSignificance[moduleGenes, 1]),
xlab = paste("Module Membership in", module, "module"),
ylab = "Gene significance for body weight",
main = paste("Module membership vs. gene significance\n"),
cex.main = 1.2, cex.lab = 1.2, cex.axis = 1.2, col = module)

1234

annot = read.csv(file = "GeneAnnotation.csv");
dim(annot)
names(annot)
probes = names(datExpr)
probes2annot = match(probes, annot$substanceBXH)
## The following is the number or probes without annotation:
sum(is.na(probes2annot))
## Should return 0.

## Create the starting data frame
geneInfo0 = data.frame(substanceBXH = probes,
geneSymbol = annot$gene_symbol[probes2annot],
LocusLinkID = annot$LocusLinkID[probes2annot],
moduleColor = moduleColors,
geneTraitSignificance,
GSPvalue)
## Order modules by their significance for weight
modOrder = order(-abs(cor(MEs, weight, use = "p")));
## Add module membership information in the chosen order
for (mod in 1:ncol(geneModuleMembership))
{
oldNames = names(geneInfo0)
geneInfo0 = data.frame(geneInfo0, geneModuleMembership[, modOrder[mod]],
MMPvalue[, modOrder[mod]]);
names(geneInfo0) = c(oldNames, paste("MM.", modNames[modOrder[mod]], sep=""),
paste("p.MM.", modNames[modOrder[mod]], sep=""))
}
## Order the genes in the geneInfo variable first by module color, then by geneTraitSignificance
geneOrder = order(geneInfo0$moduleColor, -abs(geneInfo0$GS.weight));
geneInfo = geneInfo0[geneOrder, ]


4. GO Enrichment of Modules

## Read in the probe annotation
annot = read.csv(file = "GeneAnnotation.csv");
## Match probes in the data set to the probe IDs in the annotation file
probes = names(datExpr)
probes2annot = match(probes, annot$substanceBXH)
## Get the corresponding Locuis Link IDs
allLLIDs = annot$LocusLinkID[probes2annot];
## $ Choose interesting modules
intModules = c("brown", "red", "salmon")
for (module in intModules)
{
# Select module probes
modGenes = (moduleColors==module)
# Get their entrez ID codes
modLLIDs = allLLIDs[modGenes];
# Write them into a file
fileName = paste("LocusLinkIDs-", module, ".txt", sep="");
write.table(as.data.frame(modLLIDs), file = fileName,
row.names = FALSE, col.names = FALSE)
}
## As background in the enrichment analysis, we will use all probes in the analysis.
fileName = paste("LocusLinkIDs-all.txt", sep="");
write.table(as.data.frame(allLLIDs), file = fileName,
row.names = FALSE, col.names = FALSE)

GOenr = GOenrichmentAnalysis(moduleColors, allLLIDs, organism = "mouse", nBestP = 10);

tab = GOenr$bestPTerms[[4]]$enrichment

write.table(tab, file = "GOEnrichmentTable.csv", sep = ",", quote = TRUE, row.names = FALSE)


keepCols = c(1, 2, 5, 6, 7, 12, 13);
screenTab = tab[, keepCols];
## Round the numeric columns to 2 decimal places:
numCols = c(3, 4);
screenTab[, numCols] = signif(apply(screenTab[, numCols], 2, as.numeric), 2)
## Truncate the the term name to at most 40 characters
screenTab[, 7] = substring(screenTab[, 7], 1, 40)
## Shorten the column names:
colnames(screenTab) = c("module", "size", "p-val", "Bonf", "nInTerm", "ont", "term name");
rownames(screenTab) = NULL;
## Set the width of R's output. The reader should play with this number to obtain satisfactory output.
options(width=95)
## Finally, display the enrichment table:
screenTab
module  size  p-val Bonf  nInTerm ont term name
1 black 166 3.9e-04 1.0e+00 4 BP dopamine transport
2 black 166 6.5e-04 1.0e+00 5 BP mRNA transport
3 black 166 8.0e-04 1.0e+00 6 BP RNA transport
4 black 166 8.0e-04 1.0e+00 13 MF receptor ligand activity
...

5. Visualization

5.1 NetWork Visualization

nGenes = ncol(datExpr)
nSamples = nrow(datExpr)

## Calculate topological overlap anew: this could be done more efficiently by saving the TOM
## calculated during module detection, but let us do it again here.
dissTOM = 1-TOMsimilarityFromExpr(datExpr, power = 6);
## Transform dissTOM with a power to make moderately strong connections more visible in the heatmap
plotTOM = dissTOM^7;
## Set diagonal to NA for a nicer plot
diag(plotTOM) = NA;
## Call the plot function
sizeGrWindow(9,9)
TOMplot(plotTOM, geneTree, moduleColors, main = "Network heatmap plot, all genes")

nSelect = 400
## For reproducibility, we set the random seed
set.seed(10);
select = sample(nGenes, size = nSelect);
selectTOM = dissTOM[select, select];
## There's no simple way of restricting a clustering tree to a subset of genes, so we must re-cluster.
selectTree = hclust(as.dist(selectTOM), method = "average")
selectColors = moduleColors[select];
## Open a graphical window
sizeGrWindow(9,9)
## Taking the dissimilarity to a power, say 10, makes the plot more informative by effectively changing
## the color palette; setting the diagonal to NA also improves the clarity of the plot
##png('123.png')
plotDiss = selectTOM^7;
diag(plotDiss) = NA;
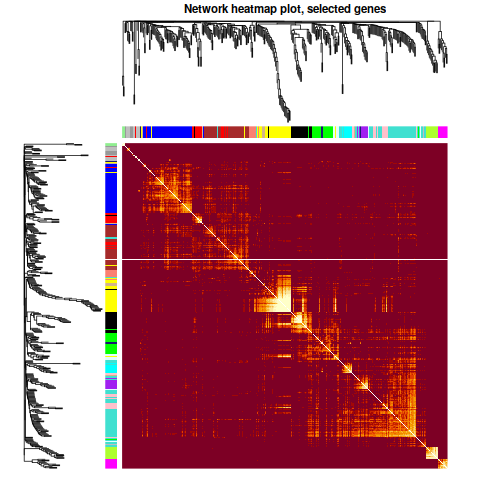
TOMplot(plotDiss, selectTree, selectColors, main = "Network heatmap plot, selected genes")

123

5.2 Visualizing the network of eigengenes

## Recalculate module eigengenes
MEs = moduleEigengenes(datExpr, moduleColors)$eigengenes
## Isolate weight from the clinical traits
weight = as.data.frame(datTraits$weight_g);
names(weight) = "weight"
## Add the weight to existing module eigengenes
MET = orderMEs(cbind(MEs, weight))
## Plot the relationships among the eigengenes and the trait
sizeGrWindow(5,7.5);
##png('123.png',width=400,height=600)
par(cex = 0.9)
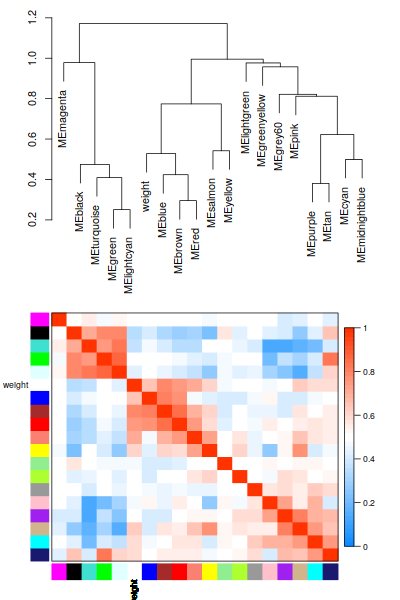
plotEigengeneNetworks(MET, "", marDendro = c(0,4,1,2), marHeatmap = c(3,4,1,2), cex.lab = 0.8, xLabelsAngle
= 90)

## Plot the dendrogram
##sizeGrWindow(6,6);
##par(cex = 1.0)
##plotEigengeneNetworks(MET, "Eigengene dendrogram", marDendro = c(0,4,2,0),
## plotHeatmaps = FALSE)
## Plot the heatmap matrix (note: this plot will overwrite the dendrogram plot)
##par(cex = 1.0)
##plotEigengeneNetworks(MET, "Eigengene adjacency heatmap", marHeatmap = c(3,4,2,2),
## plotDendrograms = FALSE, xLabelsAngle = 90)

123

6. Export of networks

6.1 Exporting to VisANT

## Recalculate topological overlap
TOM = TOMsimilarityFromExpr(datExpr, power = 6);
## Read in the annotation file
annot = read.csv(file = "GeneAnnotation.csv");
## Select module
module = "brown";
## Select module probes
probes = names(datExpr)
inModule = (moduleColors==module);
modProbes = probes[inModule];
## Select the corresponding Topological Overlap
modTOM = TOM[inModule, inModule];
dimnames(modTOM) = list(modProbes, modProbes)
## Export the network into an edge list file VisANT can read
vis = exportNetworkToVisANT(modTOM,
file = paste("VisANTInput-", module, ".txt", sep=""),
weighted = TRUE,
threshold = 0,
probeToGene = data.frame(annot$substanceBXH, annot$gene_symbol) )

nTop = 30;
IMConn = softConnectivity(datExpr[, modProbes]);
top = (rank(-IMConn) <= nTop)
vis = exportNetworkToVisANT(modTOM[top, top],
file = paste("VisANTInput-", module, "-top30.txt", sep=""),
weighted = TRUE,
threshold = 0,
probeToGene = data.frame(annot$substanceBXH, annot$gene_symbol) )

6.2 Exporting to Cytoscape

## Recalculate topological overlap if needed
TOM = TOMsimilarityFromExpr(datExpr, power = 6);
## Read in the annotation file
annot = read.csv(file = "GeneAnnotation.csv");
## Select modules
modules = c("brown", "red");
## Select module probes
probes = names(datExpr)
inModule = is.finite(match(moduleColors, modules));
modProbes = probes[inModule];
modGenes = annot$gene_symbol[match(modProbes, annot$substanceBXH)];
## Select the corresponding Topological Overlap
modTOM = TOM[inModule, inModule];
dimnames(modTOM) = list(modProbes, modProbes)
## Export the network into edge and node list files Cytoscape can read
cyt = exportNetworkToCytoscape(modTOM,
edgeFile = paste("CytoscapeInput-edges-", paste(modules, collapse="-"), ".txt", sep=""),
nodeFile = paste("CytoscapeInput-nodes-", paste(modules, collapse="-"), ".txt", sep=""),
weighted = TRUE,
threshold = 0.02,
nodeNames = modProbes,
altNodeNames = modGenes,
nodeAttr = moduleColors[inModule]);

6.3 Network3d

edges <- read.table("CytoscapeInput-edges-brown-red.txt",header=T)
nodes <- read.table("CytoscapeInput-nodes-brown-red.txt",header=T,sep='\t')

colnames(nodes)= c("nodeName", "altName", "Group")

edges$fromNode = match(edges$fromNode,nodes$nodeName)
edges$toNode = match(edges$toNode,nodes$nodeName)

Index <- read.table(text = paste(unique(edges$fromNode),0,0,"undirected","A","B",sep='\t'),sep='\t')

colnames(Index) = colnames(edges)
edges = rbind(Index,edges)

forceNetwork(Links=edges,
Nodes=nodes,
NodeID="nodeName", #指定节点显示的标签
Source="fromNode", #指定Links文件中的源节点
Target="toNode", #指定Links文件中的靶节点
Value="weight", #设定基因间连线的宽度
fontSize=20, #设定节点标签的字号,单位为像素
Group="Group", #对节点进行分组,这里可根据基因的功能进行分组,配置不同颜色
opacity=0.8, #指定图像的不透明度
zoom=TRUE, #是否允许图像缩放
arrows=TRUE, #连线是否添加箭头,显示方向
opacityNoHover=0.7, #鼠标悬停前,节点标签的不透明度
legend=TRUE, #是否显示图例
height=600, #设置图像高度
width=600 #设置图像宽度
#Nodesize = "Freq_l"
#radiusCalculation = "d.nodesize"
)
Author

Karobben

Posted on

2020-06-08

Updated on

2024-01-11

Licensed under

Comments