ggplot畫斷層圖© Karobben

ggplot畫斷層圖

ggplot畫斷層圖

library(ggplot2)
library(patchwork)

data(cars)
cars[1,2] =100000

p <- ggplot(cars,aes(x=speed,y=dist)) + geom_bar(stat='identity')

通過patchwork, 拼接得到想要的圖


p1 <- p + coord_cartesian(ylim = c(0,400))
p2 <- p + coord_cartesian(ylim = c(99998,100020))+ theme(axis.text.x = element_blank(), axis.title = element_blank(), axis.ticks.x = element_blank())
layout <- 'A\nB\nB\nB'
p2/p1 + plot_layout(design = layout)
原圖 拼接圖
tbJxSI.png 2

函數封裝

SplitBar <-  function(p, Y1,Y2,Y3, Y0=0,R=c(1,1)){
Lay = c(rep("A",R[1]),rep("B",R[2]))
layout=""
for( i in Lay){
layout=paste(layout,i,sep="\n")
}
p1 <- p + coord_cartesian(ylim = c(Y2,Y3))+
theme(axis.text.x = element_blank(),
axis.title = element_blank(), axis.ticks.x = element_blank(),
legend.position = 'none',
panel.grid = element_blank(),
panel.border = element_blank(), axis.line.y = element_line(colour = "black"))
p2 <- p + coord_cartesian(ylim = c(Y0,Y1))+ theme(title = element_blank(), plot.title = element_blank(), panel.grid = element_blank(),
panel.border = element_blank(), axis.line = element_line(colour = "black"))
p1/p2 + plot_layout(design = layout)
}

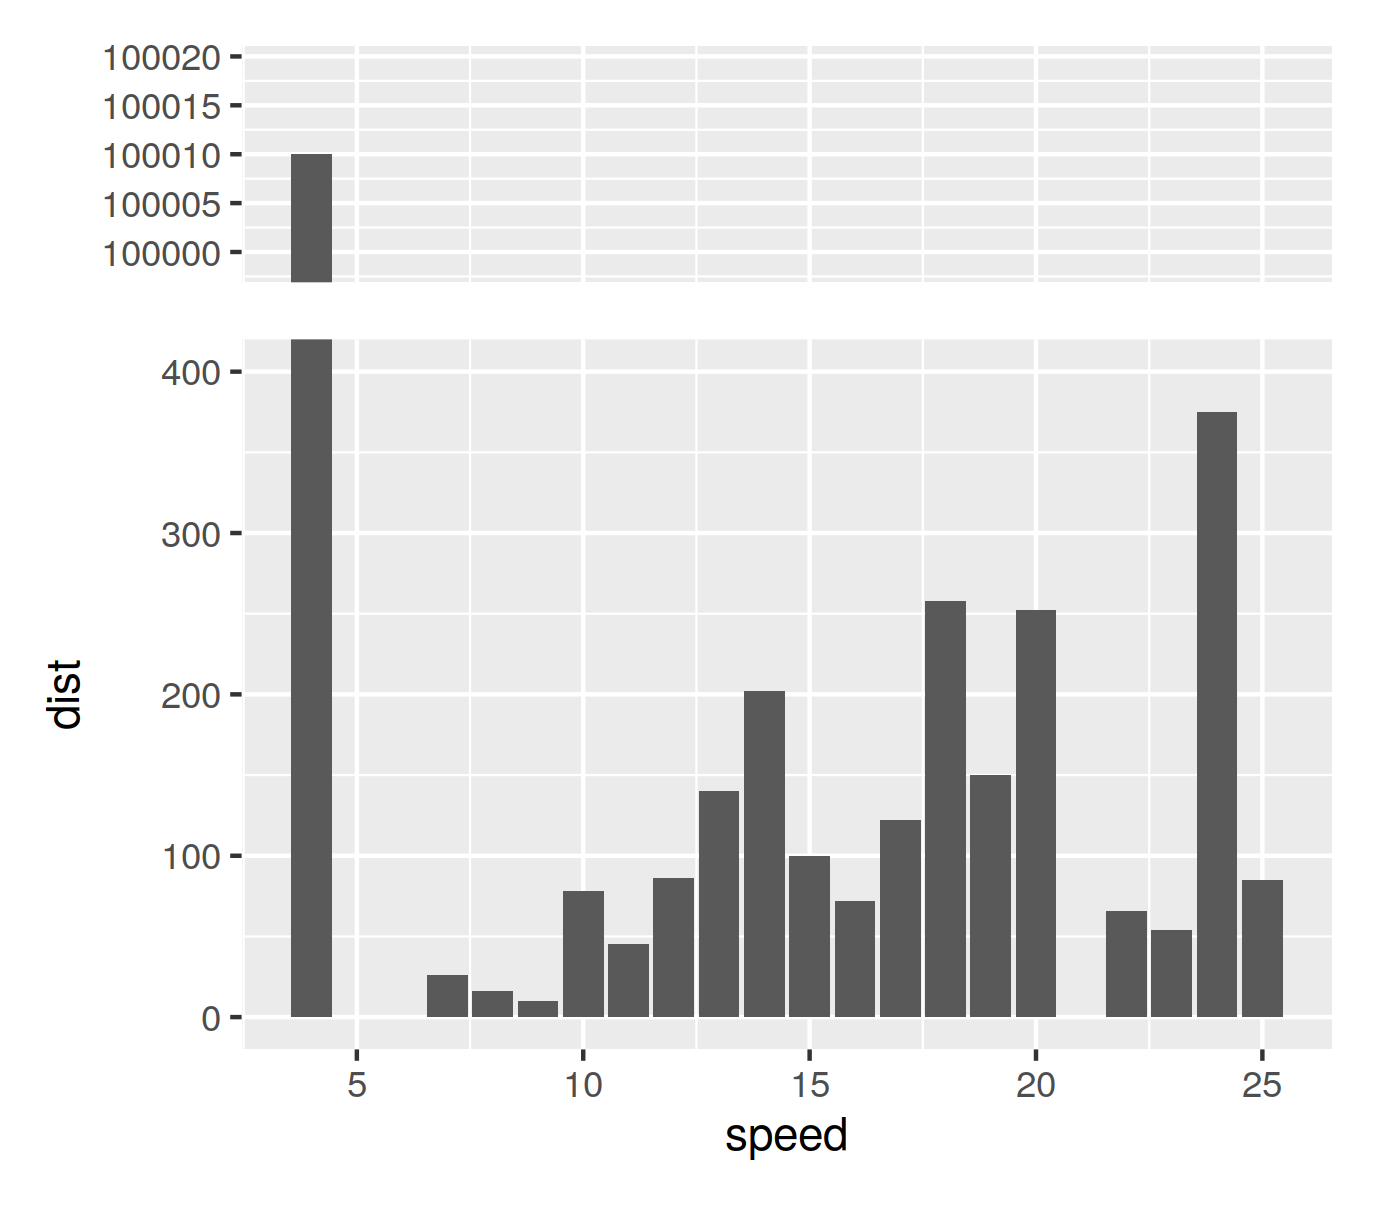
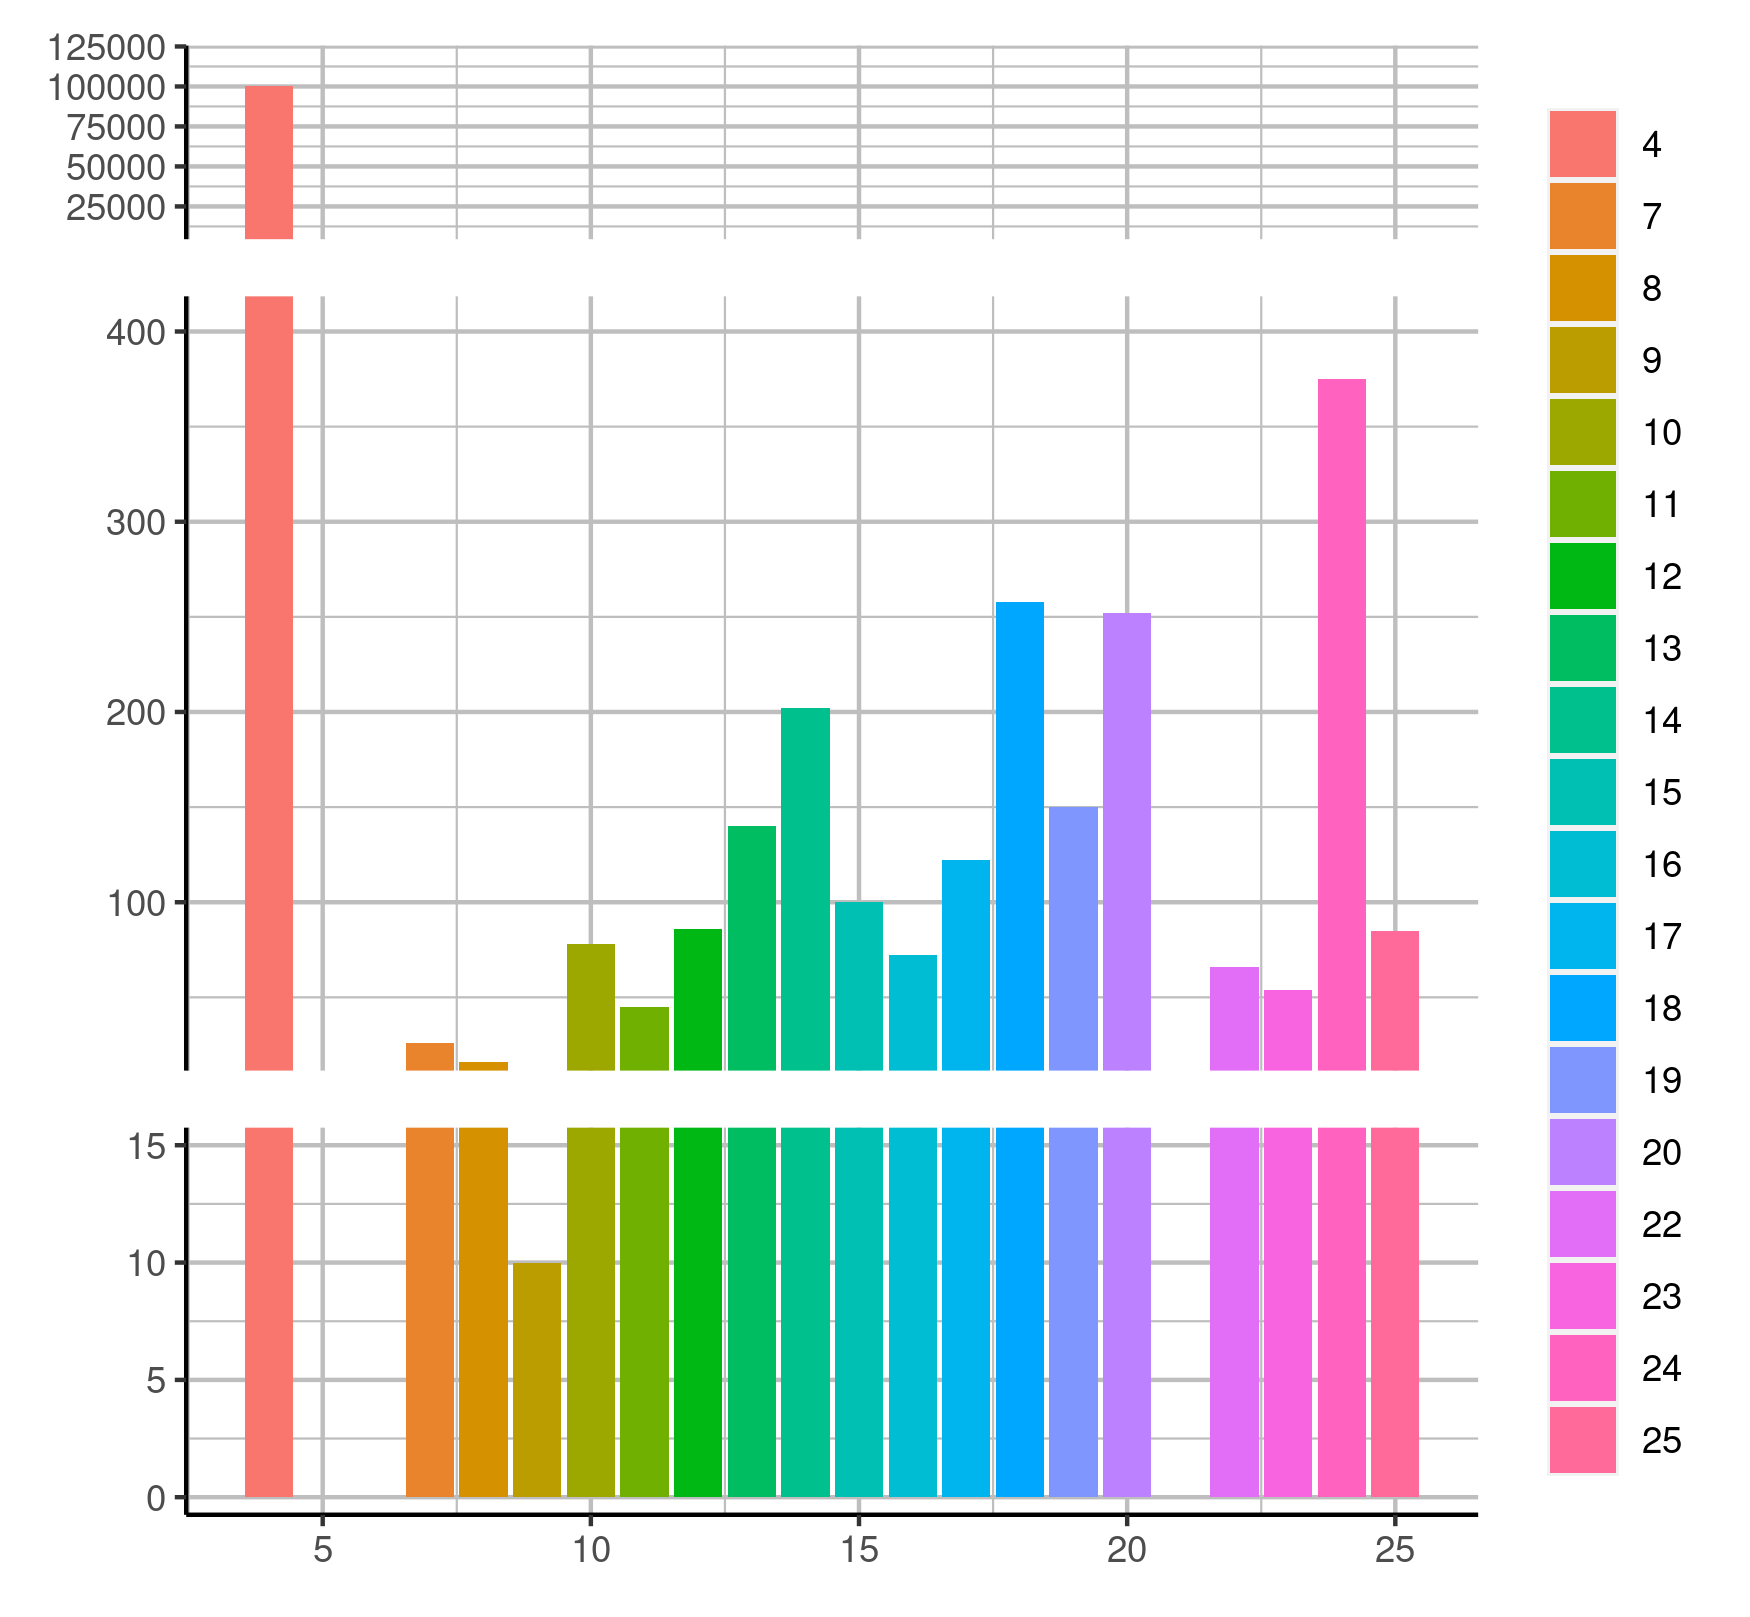
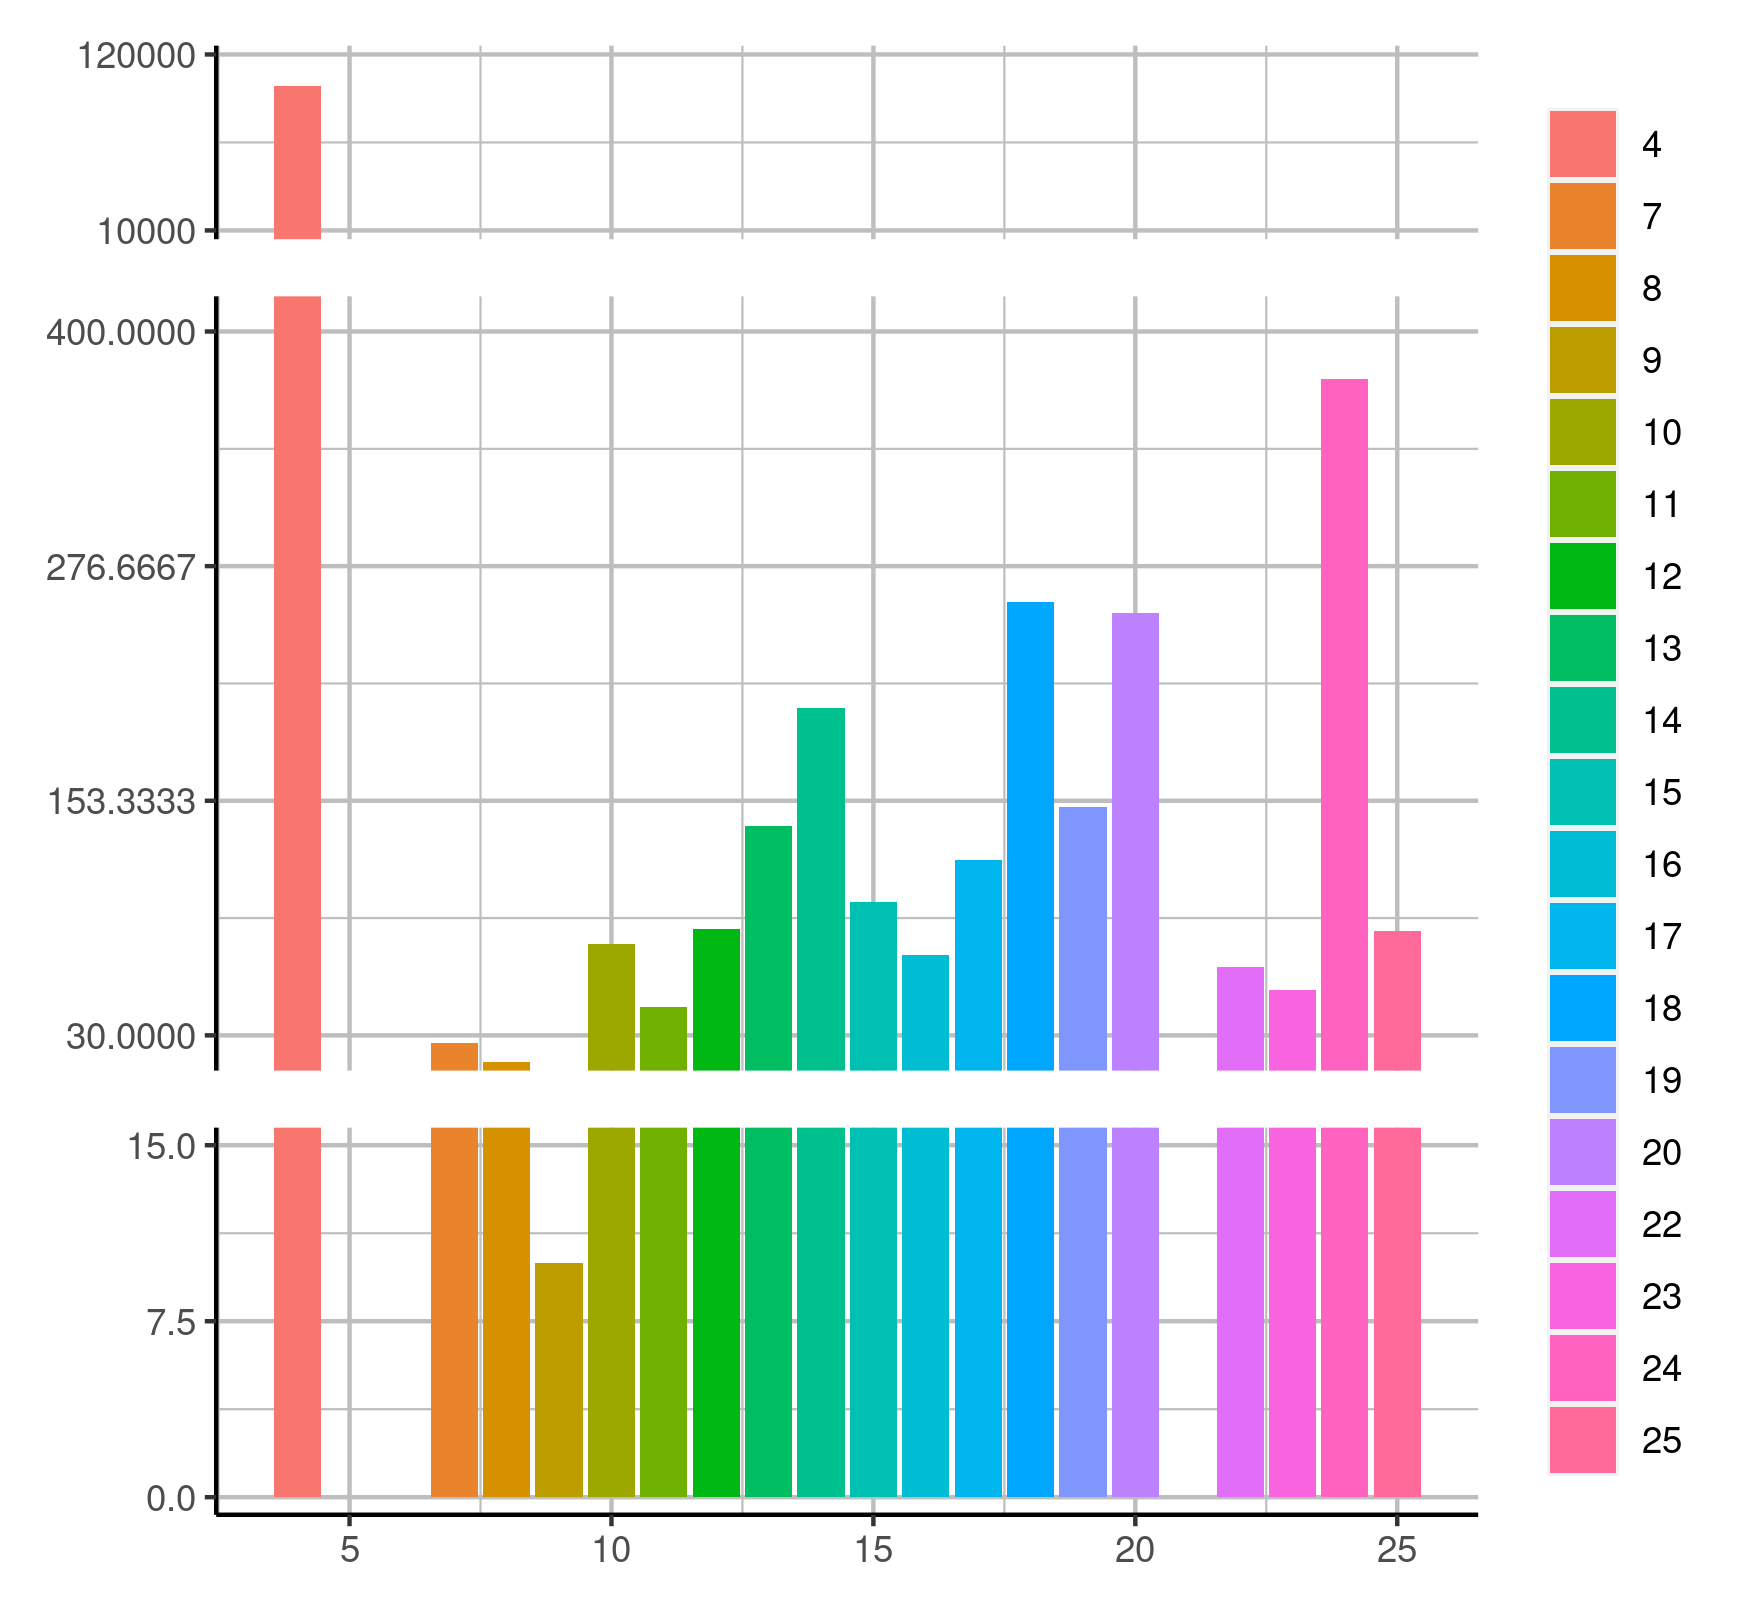
SplitBar(p,450,99998,100011,0,c(1,10))
p <- ggplot(cars,aes(x=speed,y=dist)) + geom_bar(,fill=cars$speed,stat='identity') +
theme_light()+ ggtitle('哈哈哈哈') + theme( plot.title = element_text(hjust = 0.5))

SplitBar(p,450,99998,100021,0,c(1,5))
原圖 拼接圖
tbUS61.md.png tbUCm6.md.png

Keep updating in package:

remotes::install_github("karobben/ggkaboom")
library(ggkaboom)

data(cars)
cars[1,2] =100000

p <- ggplot(cars,aes(x=speed,y=dist, fill=as.factor(speed))) + geom_bar(stat='identity')

Kaboom_break(p, c(0, 15, 30, 400, 10000, 120000), R=c(1,4, 2))
Kaboom_break(p, c(0, 15, 30, 400, 10000, 120000), R=c(1, 4, 2), panel.grid.scale = 'len', panel.grid.num = 6)
No panel.grid parameters With panel.grid parameters
Author

Karobben

Posted on

2020-06-11

Updated on

2024-01-22

Licensed under

Comments