WGCNA: an R package for weighted correlation network analysis
WGCNA: an R package for weighted correlation network analysis
Peter Langfelder1 and Steve Horvath*2
Abstract
Weighted gene co-expression network analysis is a method for describing the correlation patterns among genes across samples.
WGCNA can find clusters (modules) of high correlated genes.
Those gene clusters are called as module eigengene or intramodular hub gene.
And WGCNA can masure the correlation of modules to one another or external traits.
It can be used to identify candidate biomarkers or therapeutic targets.
Background
Functions of WGCNA:
- Cluster co-expression genes
- Correlation of modules to traits identification
- Significant modules identification
- Module annotation
- Define the network neighborhood
- Screen of nodes
- Contract network
Results
Overview of typical analysis steps and the rational behind them:
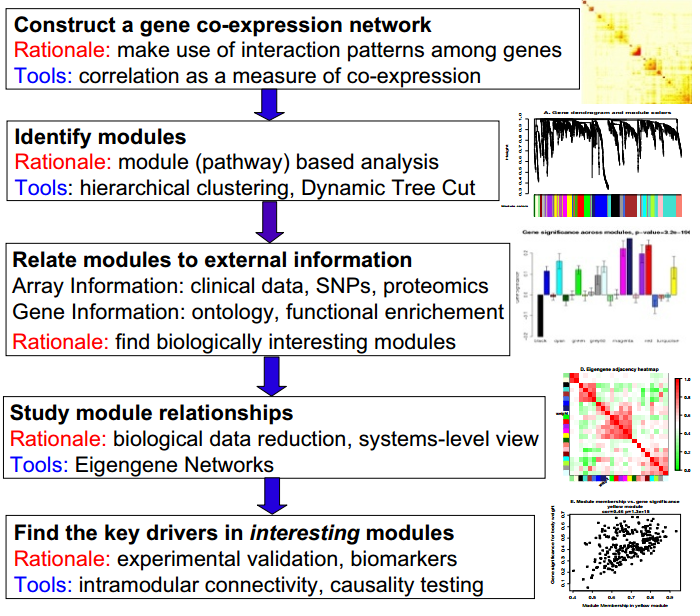
© Peter Langfelder 2008
- co-expression
- Using dynamic tree cut to idnetify modules.
- Correlation with traits:
- Clinical data, SNPs, proteomics
- ontology, functional enrichment
- find biology interest modules
- Module relationships
- Find the Key drivers in interesting modules
1. Gene Cluster
Question: Soft Threadhold power???
2. Module Detection
2.1 Algorithm
Modules are defined as clusters of densely interconnected genes.
hierarhical cluster is used to cluster the genes.
Short Coming of this algorithm:
- Difficult determines how many clusters present in the data set.
About how to determines the numbers of cluster [1]
2.2 Biological Meaning
It could reflect:
- Biological signal
- Noise
So, gene ontology information can be used.
Algorithms of Modules detection
- Fuzzy measure of module membership
- Automatic block-wise module detection
- Consensus module detection
3. Module and Gene Selection
ummmm…
= =
4. Topological Properties
To study about network concept.
- Whole Network Connectivity (degree)
- Intramodular Connectivity
- Topological Overlap
- Clustering Coefficient
…Skip
Mouse Data Application
For computational reason, only 3600 most related genes are selected.
18 modules…
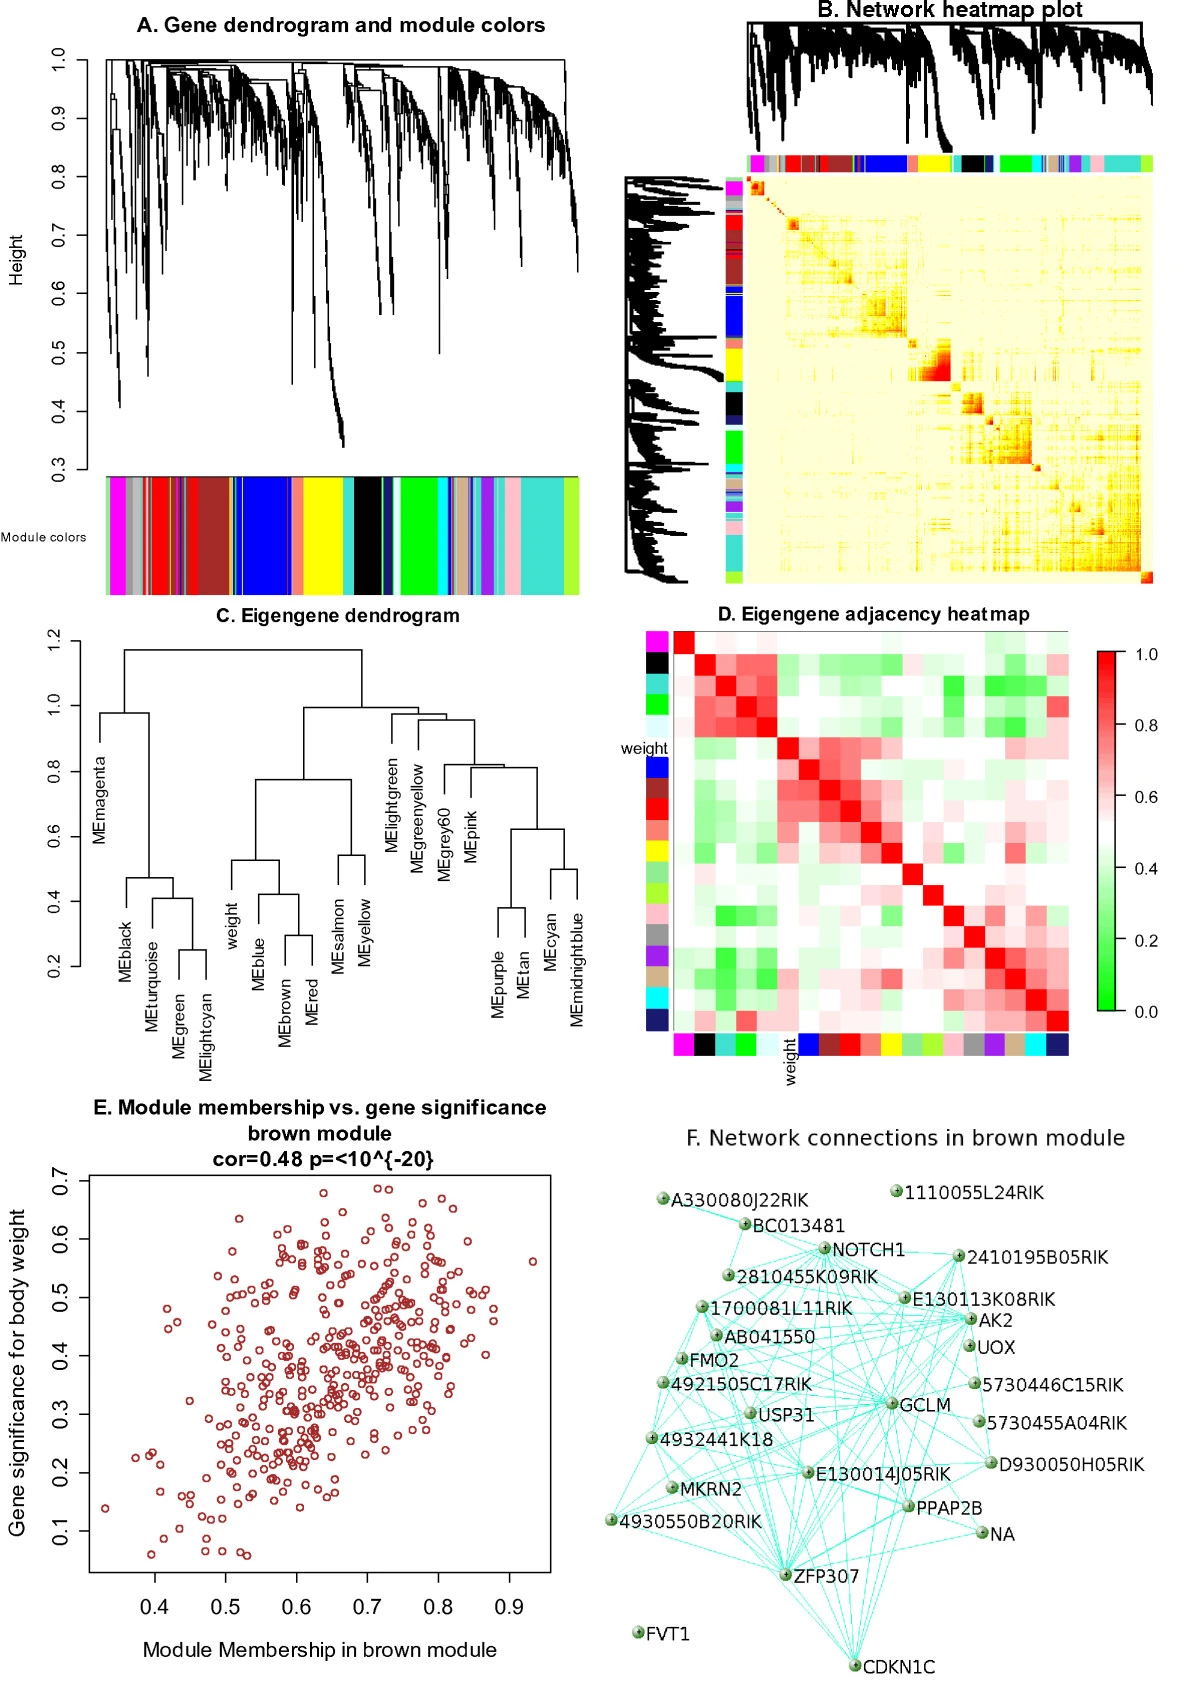
© Peter Langfelder 2008
As is how in Graph D above, weight is mostly correlated to brown, red, and salmon.
By GO enrichment result, we can find that brown is significantly enriched in categories “glycoprotein” and “signal”, red is enriched in “cell cycle”, and “salmon” is enriched in “chromosome”. Overall, it is biological meaningful.
Figure E shows body weight between genes significant…
WGCNA: an R package for weighted correlation network analysis
https://karobben.github.io/2020/07/07/LearnNotes/paper_WGCNA/


