GGmap: geom_map | ggplot for maps

GGmap: geom_map | ggplot for maps

Install

install.packages('ggalt')  

文件下载: CLIWOC15.csv
https://raw.githubusercontent.com/ljtyduyu/DataWarehouse/master/File/CLIWOC15.csv (也许需要科学上网)

library(ggplot2)  #需安装最新的2.0.0版本
library(dplyr) #你也可以用内置的subset函数来代替filter函数
library(ggalt) #安装方法: devtools::install_github("hrbrmstr/ggalt")。需安装加载devtools包
library(ggthemes)

world <- map_data("world")
world <- world[world$region != "Antarctica",] # 剔除南极洲


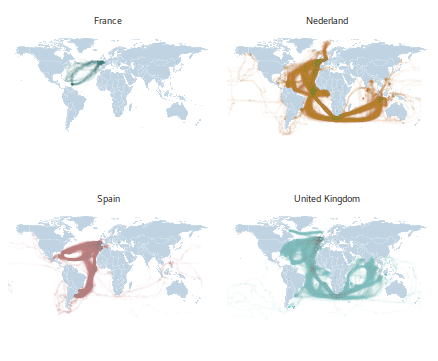
dat <- read.csv("CLIWOC15.csv")
dat <- filter(dat, Nation != "Sweden")

ggplot()+ geom_map(data=world, map=world,
aes(x=long, y=lat, map_id=region), fill="#00518E",
color="white", fill="#7f7f7f", size=0.05, alpha=1/4)+
geom_point(data=dat,aes(x=Lon3, y=Lat3, color=Nation),size=0.15, alpha=1/100)+
scale_color_tableau()+ coord_proj("+proj=wintri")+ facet_wrap(~Nation)+
theme_map()+ theme(strip.background=element_blank())+ theme(legend.position="none")
ggsave('map.png',w=500,h=450)
## graph shows as in head

1

library(map)

library(ggplot2)
library(maps)

data(us.cities)
big_citi <- subset(us.cities,pop > 500000) ##人口大于50万的城市


##Quick plot (left)
qplot(long,lat,data=big_citi) + borders("state",size=0.5)
##ggsave('map2.png',w=4,h=2.6)

##Quick plot (right)
library(ggthemes)
library(ggrepel)
qplot(long,lat,data=big_citi) + borders("state",size=0.5) +theme_map()+
geom_label_repel(data=big_citi,aes(x=long,y=lat,label=name))
##ggsave('map3.png',w=8,h=5.2)
dSsgG4.jpg dSsciF.jpg
map2.png map3.png

More

GGmap: geom_map | ggplot for maps

https://karobben.github.io/2020/08/13/R/GGmap/

Author

Karobben

Posted on

2020-08-13

Updated on

2024-01-22

Licensed under

Comments