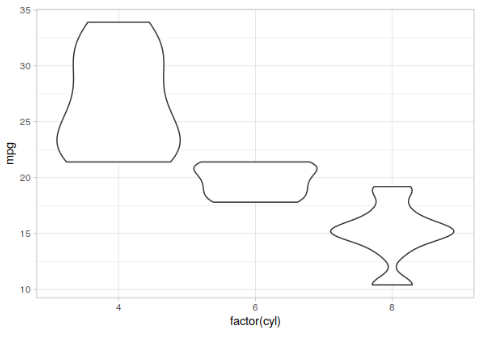
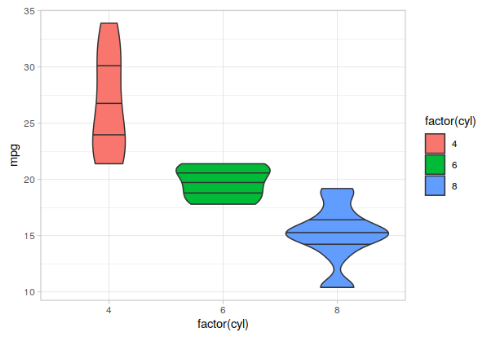
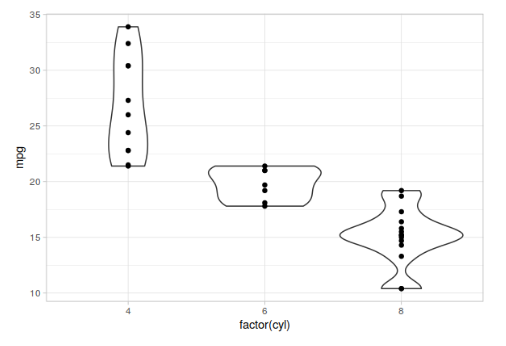
0 Posted 2020-08-13Updated 2024-01-11R / Plot / GGPLOTa few seconds read (About 58 words)geom_violin| ggplot examplesQuick Start library(ggplot2)p <- ggplot(mtcars, aes(factor(cyl), mpg))p + geom_violin()+ geom_point() + theme_light() scale p + geom_violin(scale = "width")+ theme_light() draw_quantiles p + geom_violin(aes(fill = factor(cyl)),draw_quantiles = c(0.25, 0.5, 0.75)) geom_violin| ggplot exampleshttps://karobben.github.io/2020/08/13/R/geom_violin/AuthorKarobbenPosted on2020-08-13Updated on2024-01-11Licensed under#RPlotggplot