Analyzing DNA/Protein Band with Opencv, Python
Analyzing DNA/Protein Band with Opencv, Python
Before starting:
You can find some fundamental codes of Opencv at: My Blog
You can also find the image img1.tif at My GitHub
Loading img
|
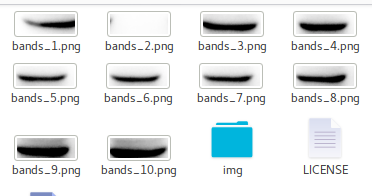
Selecting the Bands
|
Targeting the Bands
|
Result:

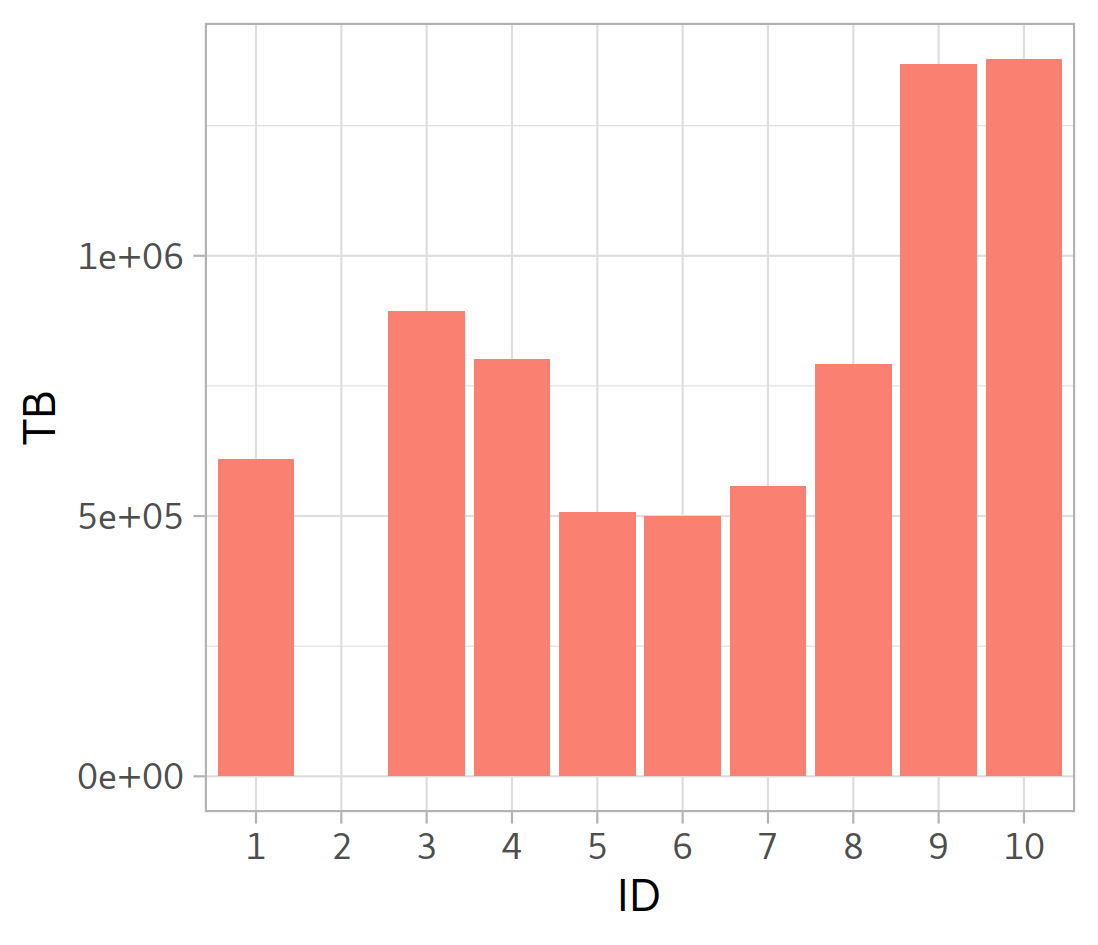
Calculating the Grey-Grades
|
Result:
|
|
BiliBili:史上最不正經的生物狗
Analyzing DNA/Protein Band with Opencv, Python


