from shapely.geometry import LineString
from shapely.geometry import Point
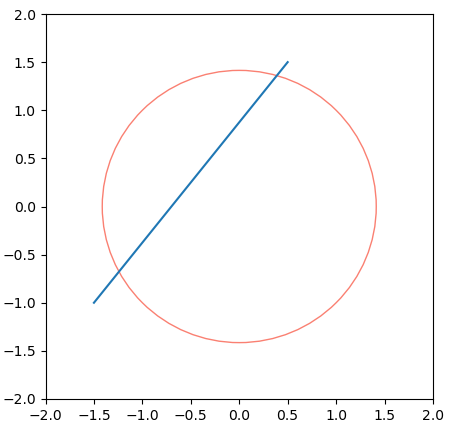
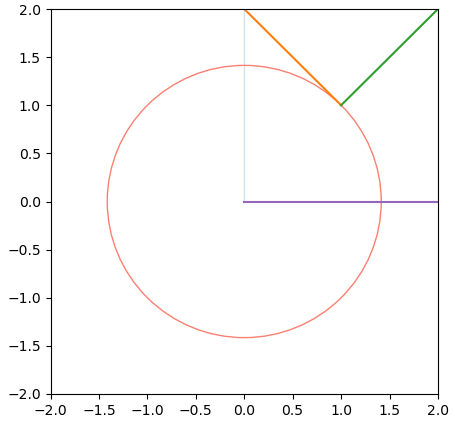
def Inters_CL(Center, P1, L1, L2, Plot=True):
Line = np.array([L1, L2])
radius = euclidean(Center, P1)
Inter_vertics = []
p = Point(Center).buffer(radius)
l = LineString(Line)
if p.intersects(l) == True:
i = p.intersection(l)
for index in range(len(i.boundary)):
if i.boundary[index].coords[0] not in Line:
Inter_vertics += [i.boundary[index].coords[0]]
Inter_vertics = np.array(Inter_vertics)
if Plot==True:
circle1 = plt.Circle(Center, radius, color='salmon', fill=False)
ax.add_patch(circle1)
ax.set(xlim=(-2,2), ylim=(-2,2),)
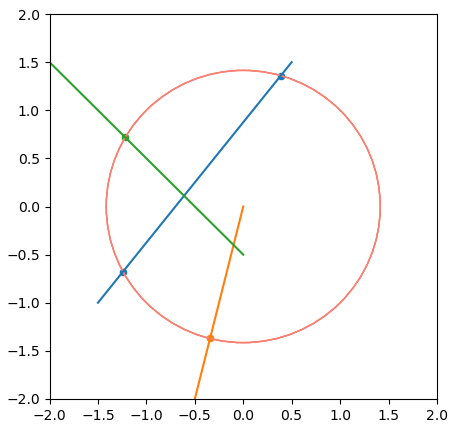
sns.lineplot(x=Line[:, 0], y = Line[:, 1])
sns.scatterplot(x= Inter_vertics[:, 0], y = Inter_vertics[:, 1])
return Inter_vertics
fig, ax = plt.subplots(figsize = (5,5))
Inters_CL(Center, P1, L1, L2)
Inters_CL(Center, P1, [-0.5,-2], [0,0])
Inters_CL(Center, P1, [-2, 1.5], [0,-0.5])
|