library(ggplot2)
library(reshape2)
library(stringr)
library(GenomicFeatures)
GENE = "Mmp1"
GTF <- read.table("../DB/Drosophila_melanogaster.BDGP6.32.104.chr.EGFP.GAL4.mCD8GFP.gtf", sep ='\t')
GTF2 <- GTF[grep("transcript_id", GTF$V9),]
GTF2$TranID <- as.data.frame(str_split_fixed(as.data.frame(str_split_fixed(GTF2$V9, "transcript_id ", 2))[[2]], ";", 2))[[1]]
GTF2$GENE <- as.data.frame(str_split_fixed(as.data.frame(str_split_fixed(GTF2$V9, "gene_name ", 2))[[2]], ";", 2))[[1]]
GTF2 <- GTF2[GTF2$V3 %in% c("exon", "start_codon", "stop_codon"),]
wh = GTF2$V4[grep(GENE, GTF2$V9)]
TB <- read.table("Mmp1.csv")
TB$ID=paste(TB$V1, TB$V2)
TB$X1 = apply(TB[c("V7","V8")], 1, min)
TB$X2 = apply(TB[c("V7","V8")], 1, max)
TB$Y = as.numeric(as.factor(TB$ID))*-1 +1
RegionPlot <- function(GENE){
MAX = max(as.numeric(as.matrix(GTF2[GTF2$GENE==GENE,c("V4", "V5")])))
MIN = min(as.numeric(as.matrix(GTF2[GTF2$GENE==GENE,c("V4", "V5")])))
CHM = head(GTF2[GTF2$GENE==GENE,"V1"],1)
tmp_GTF = GTF2[GTF2$V4 >= MIN,]
tmp_GTF = tmp_GTF[tmp_GTF$V5 <= MAX,]
tmp_GTF = tmp_GTF[tmp_GTF$V1 == CHM,]
tmp_TB = TB[-c(17,27),]
ggplot()+ theme_bw()+
geom_line(data=tmp_GTF, aes(x= V4, y=TranID, group=TranID))+
geom_tile(data=tmp_GTF, aes(x=(V4+V5)/2, y=TranID, width= abs(V5-V4), height= .9, color=V3), fill='grey')+
scale_color_manual(values = c("black","red","blue")) +
geom_line(data=tmp_TB, aes(x= V7, y=ID, group=Y), size=1, alpha= .6)+
geom_tile(data=tmp_TB, aes(x= (X1+X2)/2, width= abs(V8-V7),y=ID, height= .9,fill=V1), size=1, color="black")+ xlim(c(MIN, MAX))+
facet_grid(V1~., space = 'free', scales = 'free')
}
RegionPlot_fact <- function(GENE){
MAX = max(as.numeric(as.matrix(GTF2[GTF2$GENE==GENE,c("V4", "V5")])))
MIN = min(as.numeric(as.matrix(GTF2[GTF2$GENE==GENE,c("V4", "V5")])))
CHM = head(GTF2[GTF2$GENE==GENE,"V1"],1)
tmp_GTF = GTF2[GTF2$V4 >= MIN,]
tmp_GTF = tmp_GTF[tmp_GTF$V5 <= MAX,]
tmp_GTF = tmp_GTF[tmp_GTF$V1 == CHM,]
tmp_TB = TB[-c(17,27),]
TRANS_list = list()
for( TRANS in unique(tmp_GTF$TranID)){
tmp_Tran_TB <- tmp_GTF[tmp_GTF$TranID == TRANS,c("V4","V5")]
C_tmp = c()
for(i in c(1:nrow(tmp_Tran_TB))){
C_tmp = c(C_tmp, c(tmp_Tran_TB[i,1]:tmp_Tran_TB[i,2]))
}
tmp = list(C_tmp)
names(tmp) = TRANS
TRANS_list <- append(TRANS_list, tmp)
}
Seq_list = list()
for( TRANS in unique(tmp_TB$ID)){
tmp_Tran_TB <- tmp_TB[tmp_TB$ID == TRANS,c("X1","X2")]
C_tmp = c()
for(i in c(1:nrow(tmp_Tran_TB))){
C_tmp = c(C_tmp, c(tmp_Tran_TB[i,1]:tmp_Tran_TB[i,2]))
}
tmp = list(C_tmp)
names(tmp) = TRANS
Seq_list <- append(Seq_list, tmp)
}
RESULT = data.frame()
for(TRANS in names(TRANS_list)){
for(Seq in names(Seq_list)){
Cover1 = table(TRANS_list[[TRANS]] %in% Seq_list[[Seq]])['TRUE'][[1]]/ length(TRANS_list[[TRANS]])
Cover2 =
table(Seq_list[[Seq]] %in% TRANS_list[[TRANS]])['TRUE'][[1]]/ length(Seq_list[[Seq]])
RESULT = rbind(RESULT, data.frame(TRANS=TRANS, Seq=Seq, Cover1= Cover1, Cover2 = Cover2))
}
}
RESULT[is.na(RESULT)] <- 0
RESULT$Cover = apply(RESULT[3:4], 1, sum)
RESULT <- RESULT[order(RESULT$Cover,decreasing = T),]
RESULT <- RESULT[!duplicated(RESULT$Seq),]
LIST =c()
for( i in unique(RESULT$TRANS)){
LIST= c(LIST, c(i, as.character(RESULT$Seq[RESULT$TRANS == i])))
}
tmp_GTF$TranID <- factor(tmp_GTF$TranID, levels= unique(LIST))
tmp_TB$ID <- factor(tmp_TB$ID, levels= LIST)
tmp_GTF$TranID <- factor(tmp_GTF$TranID, levels= unique(LIST))
colnames(tmp_GTF)[c(4,5,10)] <- c("X1", "X2", "ID")
tmp_TB['V3'] <- "exon"
TB_plot <- rbind(tmp_GTF[c("X1", "X2", "ID", "V3")], tmp_TB[c("X1", "X2", "ID", "V3")])
TB_plot$ID <- factor(TB_plot$ID, levels=rev.default(LIST))
TB_plot$TRANS <- RESULT$TRANS[match(TB_plot$ID, RESULT$Seq)]
TB_plot$TRANS[is.na(TB_plot$TRANS)] <- TB_plot$ID[is.na(TB_plot$TRANS)]
TB_plot$Cove = RESULT$Cover1[match(TB_plot$ID, RESULT$Seq)]
TB_plot$Cove[is.na(TB_plot$Cove)] <- 1
ggplot(TB_plot[TB_plot$Cove >=.5,], aes(fill=TRANS))+ theme_bw()+
geom_line(aes(x= X1, y=ID, group=ID))+
geom_tile(aes(x=(X1+X2)/2, y=ID, width= abs(X2-X1), height= .9, color=V3), fill='grey')+
scale_color_manual(values = c("black","red","blue")) + xlim(c(MIN, MAX)) +
facet_grid(TRANS~., space = 'free', scales = 'free')
}
library(ggbio)
library(GenomicFeatures)
library(clusterProfiler)
library(org.Dm.eg.db)
library(Rsamtools)
txdb <- makeTxDbFromGFF(file="../DB/Drosophila_melanogaster.BDGP6.32.104.chr.EGFP.GAL4.mCD8GFP.gtf", format="gtf")
Trans <- transcriptsBy(txdb, "gene")
tmp <- bitr(names(Trans), fromType="FLYBASE", toType="SYMBOL", OrgDb="org.Dm.eg.db")
names(Trans)[!is.na(tmp[[2]][match(names(Trans), tmp[[1]])])] <- tmp[[2]][match(names(Trans), tmp[[1]])][!is.na(tmp[[2]][match(names
(Trans), tmp[[1]])])]
bam<-BamFile(file="../Bam/G50-FE_TUMOR-a_S37Aligned.sortedByCoord.out.bam", index="../Bam/G50-FE_TUMOR-a_S37Aligned.sortedByCoord.out.bam.bai")
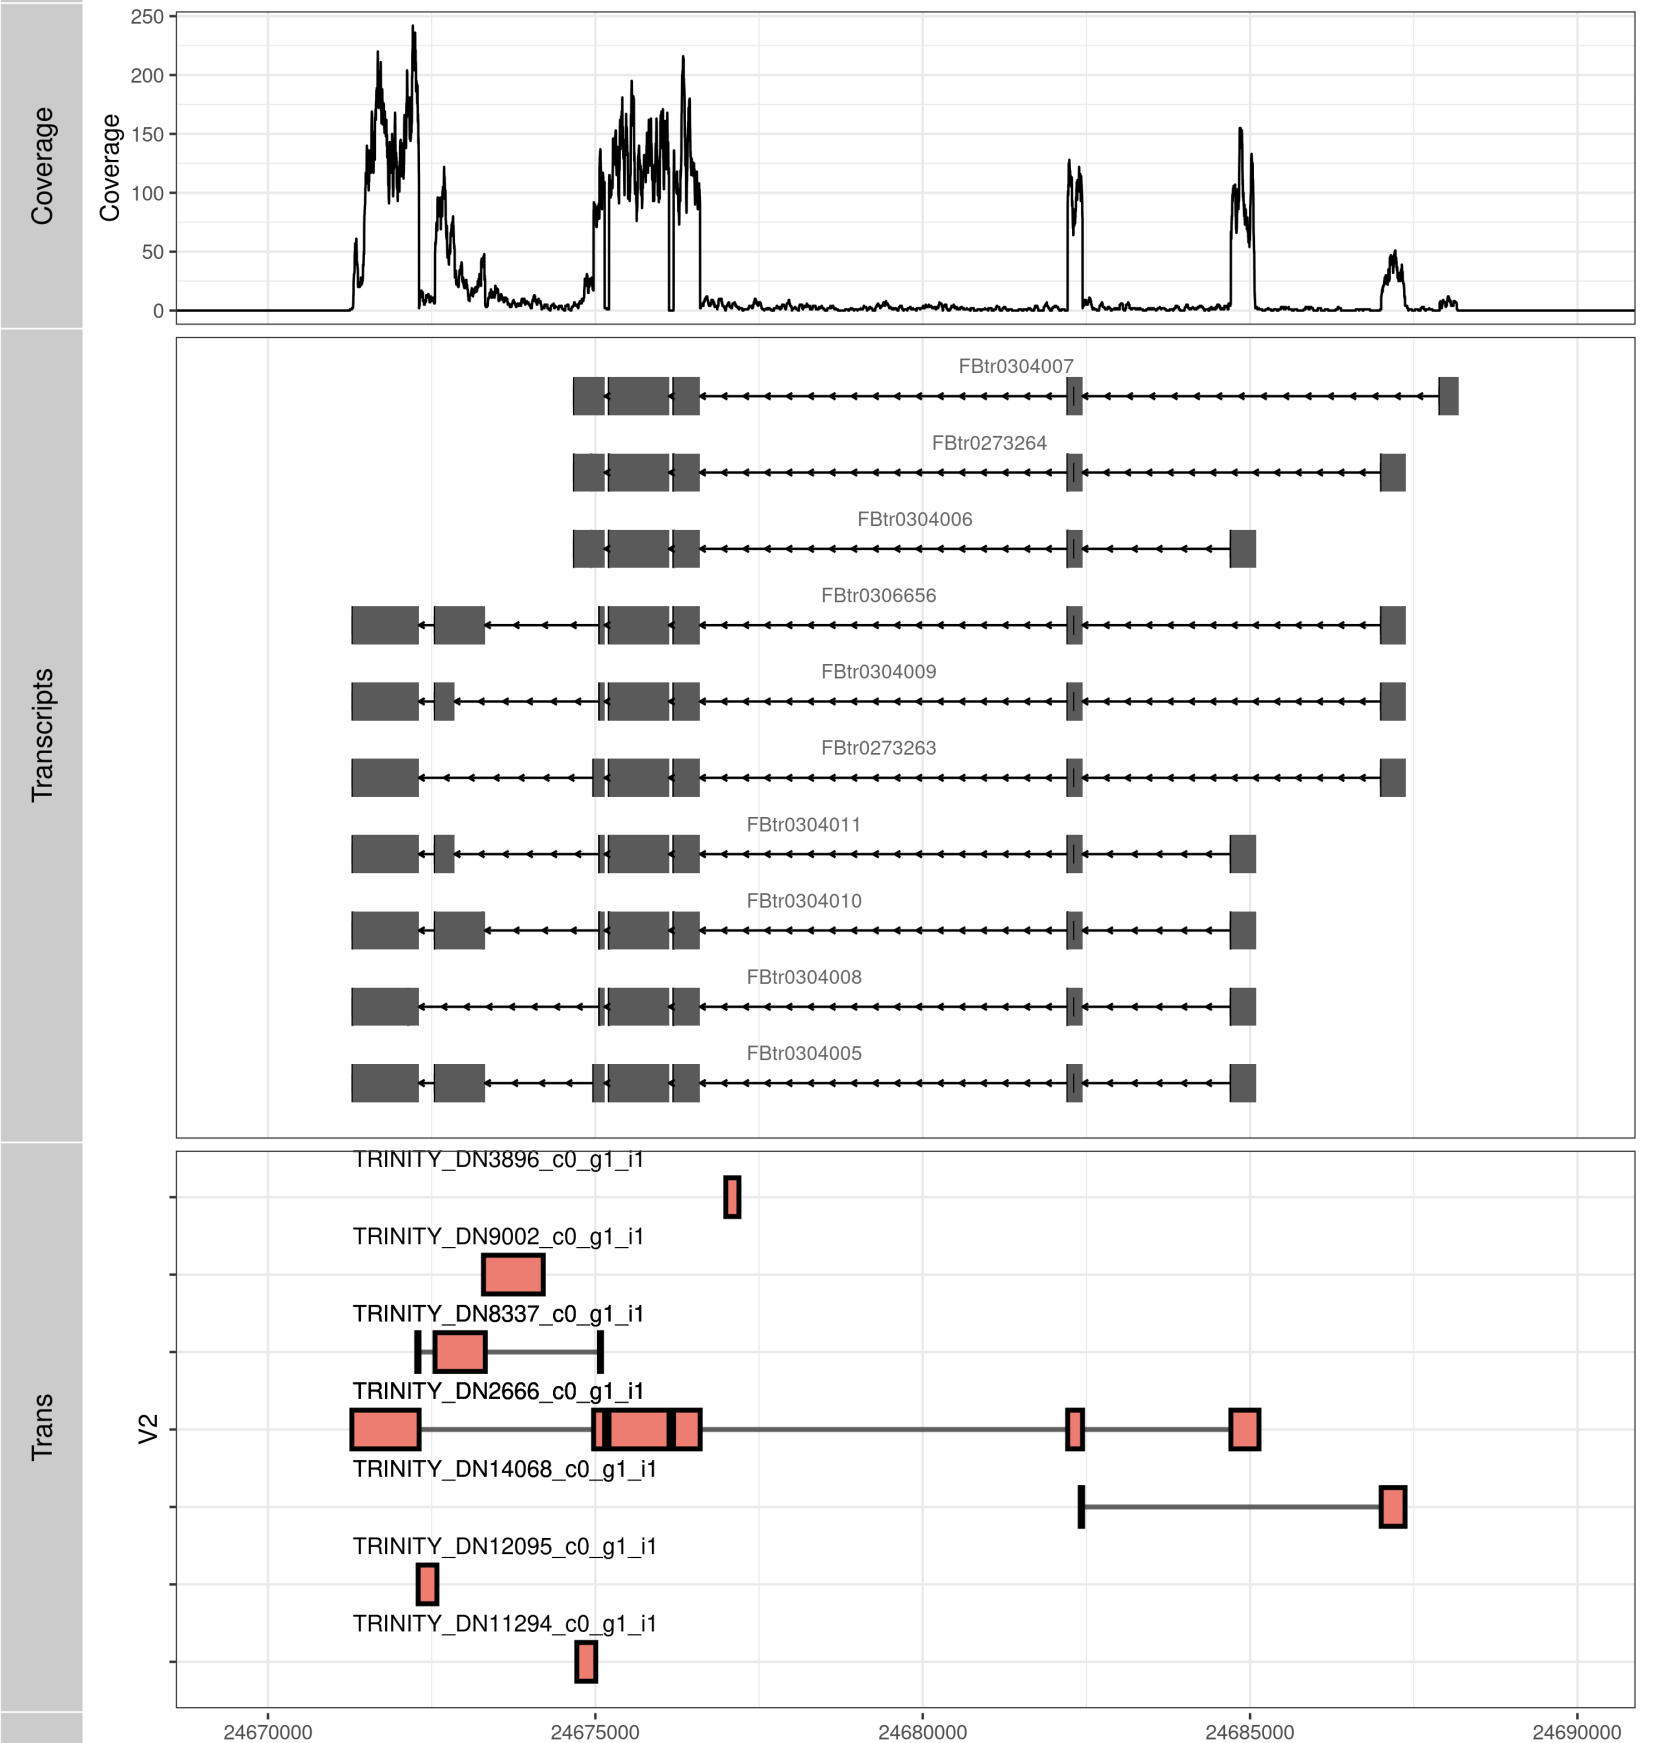
RegionPlot_ggbio <-function(GENE, SAMPLE="G50-FE_TUMOR-a_S37"){
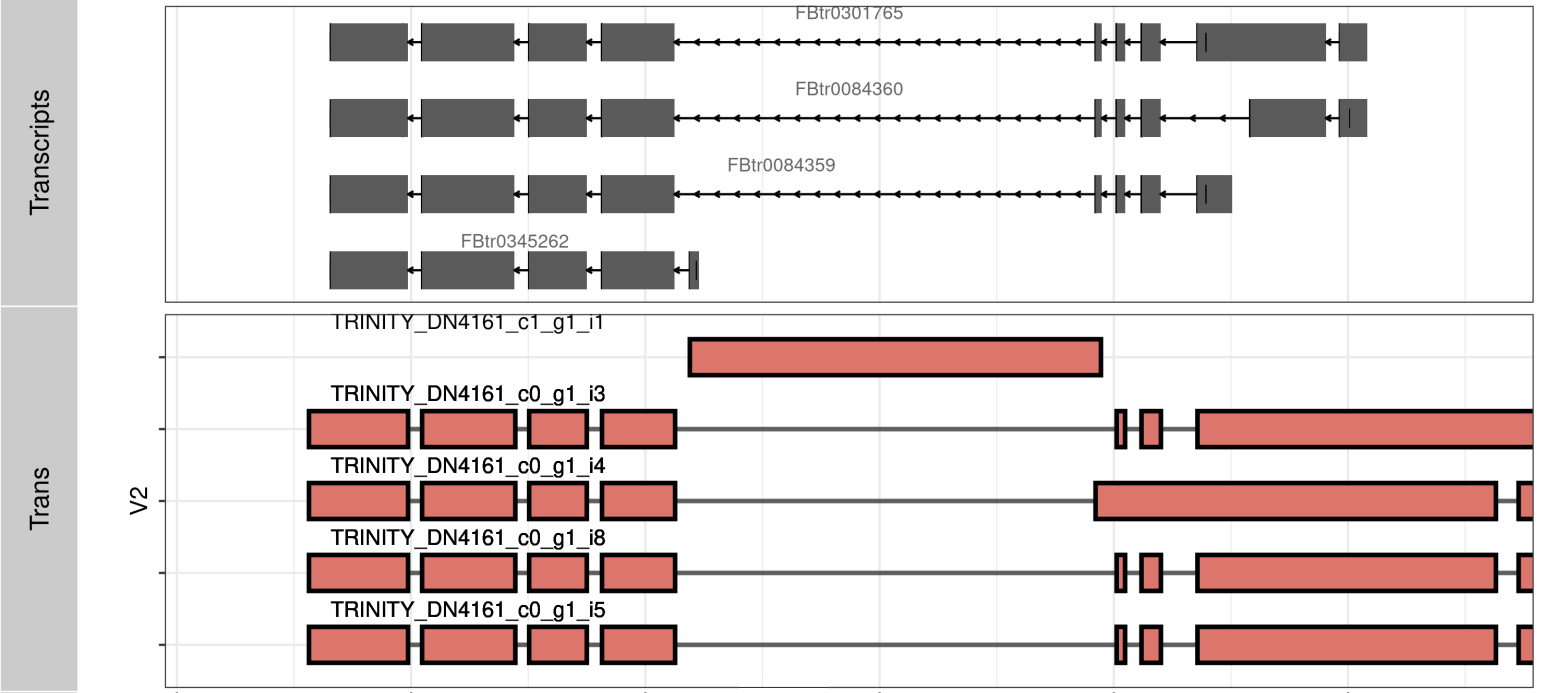
P1 <- autoplot(txdb, which= Trans[[GENE]])+ theme_bw()
tmp = range(Trans[[GENE]])
rg = c(tmp@ranges@start, tmp@ranges@start+tmp@ranges@width)
wh = as(c(paste(tmp@seqnames@values, ":", tmp@ranges@start, "-", tmp@ranges@start+tmp@ranges@width, sep ="")), "GRanges")
MAX = wh@ranges@start + wh@ranges@width
MIN = wh@ranges@start
CHM = wh@seqnames@values
tmp_TB = TB[-c(17,27),]
tmp_TB <- tmp_TB[tmp_TB$V1==SAMPLE,]
tmp_TB$V2 <- factor(tmp_TB$V2, levels=unique(tmp_TB$V2))
P_TRANS <- ggplot()+ theme_bw()+
scale_color_manual(values = c("black","red","blue")) +
geom_line(data=tmp_TB, aes(x= V7, y=V2, group=Y), size=1, alpha= .6, show.legend = F)+
geom_tile(data=tmp_TB, aes(x= (X1+X2)/2, width= abs(V8-V7),y=V2, height= .5,fill=V1), size=1, color="black", show.legend = F)+ xlim(c(MIN, MAX))+theme(axis.text.y = element_blank())+
geom_text(data=tmp_TB, aes(x= MIN, y=as.numeric(V2)+.5, label=V2), vjust = .5, hjust =0, size = 3.5)
P2 <- autoplot(bam, which =wh, stat = "coverage") + theme_bw() + theme(legend.position="none") + coord_cartesian(xlim =c(wh@ranges@start, wh@ranges@start + wh@ranges@width))
tracks(Coverage=P2, Transcripts=P1, Trans= P_TRANS, heights = c(0.4, Trans[[GENE]]@seqnames@lengths * .1, length(unique(tmp_TB$V2))*.1), title=SAMPLE) + ylab("")
H = 2.58 + (Trans[[GENE]]@seqnames@lengths +length(unique(tmp_TB$V2))) *.48
ggsave(paste('img/', SAMPLE,"_",GENE,".png",sep=""), w= 10, h = H)
}
for(SAMPLE in unique(TB$V1)){
print(SAMPLE)
if(SAMPLE != "G50-FE_TUMOR-b_S38"){
BAM = paste("../Bam/",SAMPLE,"Aligned.sortedByCoord.out.bam", sep="")
BAI = paste("../Bam/",SAMPLE,"Aligned.sortedByCoord.out.bam.bai", sep="")
bam<-BamFile(file= BAM, index= BAI)
RegionPlot_ggbio(GENE, SAMPLE)
}
}
|