Dash-bio, powered by plotly, python
What is dash and how wants dash
Dash is the original low-code framework for rapidly building data apps in Python, R, Julia, and F# (experimental). Written on top of Plotly.js and React.js, Dash is ideal for building and deploying data apps with customized user interfaces. It’s particularly suited for anyone who works with data. Through a couple of simple patterns, Dash abstracts away all of the technologies and protocols that are required to build a full-stack web app with interactive data visualization. Dash is simple enough that you can bind a user interface to your code in less than 10 minutes.
Dash apps are rendered in the web browser. You can deploy your apps to VMs or Kubernetes clusters and then share them through URLs. Since Dash apps are viewed in the web browser, Dash is inherently cross-platform and mobile ready. There is a lot behind the framework. Plotly develops Dash and also offers a platform for writing and deploying Dash apps in an enterprise environment. If you’re interested, please get in touch.
From: dash.plotly.com
Examples: Dash Galleries
Installation
|
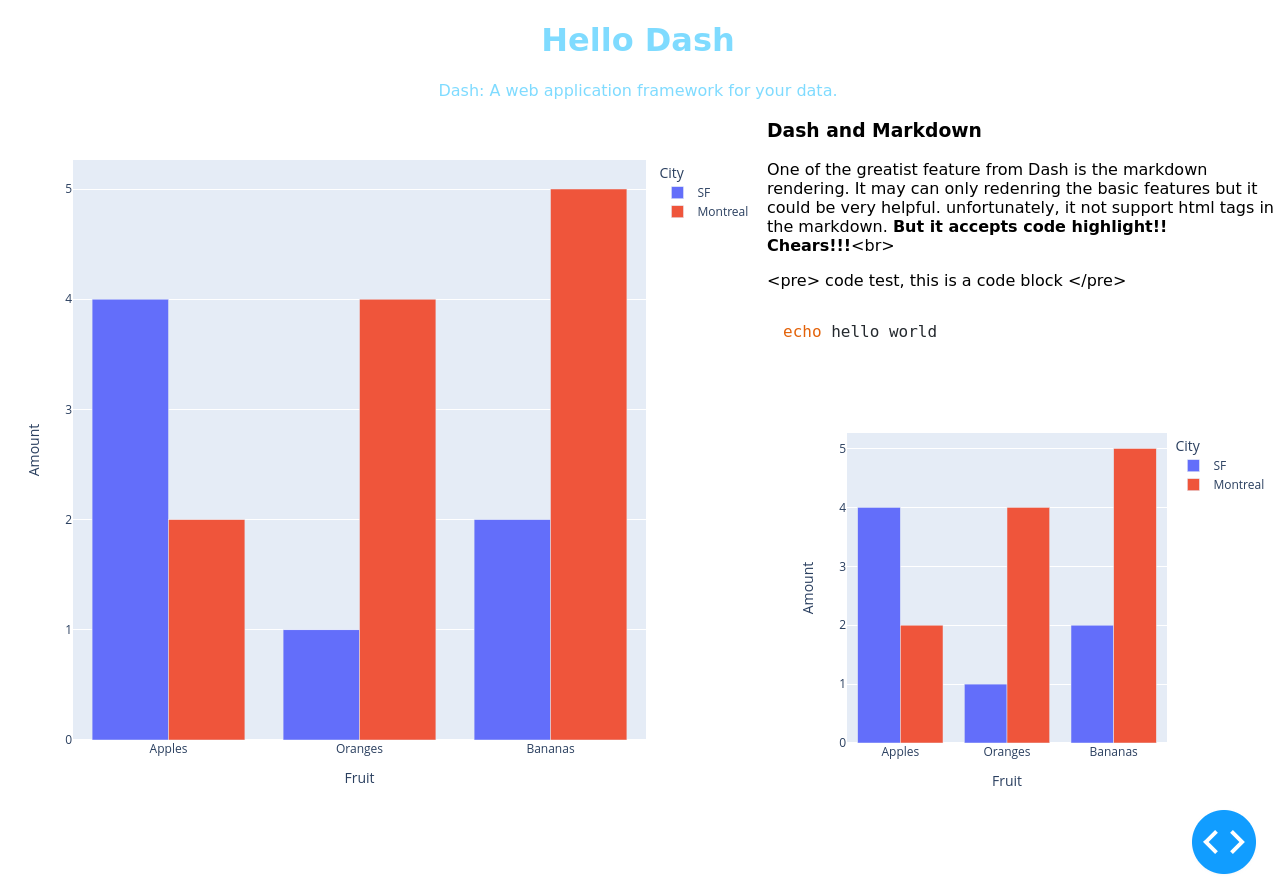
Hello Word for Dash
|
 |
|---|
How Dash Works
For the example above, main layouts information was stored in app.layout. It is a list. Each part is arranged horizontally from top to bottom. We can add tags for html one by one. For example, the h1 tag, div tag.
Customize Hello Dash
Codes for Dashboard
|
Styles
Height auto-size by the window
50% of the height of the current window
|
Window overflow-show
|
Call back
Codes for Call back example
|
Example shw: dash.plotly.com
Explain
Input widgets is from dash.dcc.Input. By giving an id as my-input, it could be called back. After we added it in a thread @app.callback, it can update automatically whenever you made a change.
For adding more callback widgets, we can add, Dropdown widgets for instance, and show the result on a new line. We can’t add the Input&Output in the old thread directly. But we can add it in a new thread.
Two things for callback functions:
- A threads is paired with function behind.
- The parameters in the function following the order of the
Inputfrom the@threads.
When you paired a thread and function, the like below:
|
In this result, it would accepts the data from widget ‘id3’ and ‘id2’. New variable P3 is returned and be assigned into the widget ‘id1’. You can use it to make a sample calculator.
Codes for Call back example
|
Use local picture
The easiest and lightest way to using local picture is cite a picture in Markdown. But before doing that, you should make a directory assets and then, put the picture in it.
|
Plots
|
Blank Background for plot
|
Pileup example
This function if for make a igv like graph.
The basic example is in this link. There is a few things worth to mention:
- The reference genome is ‘2bit’ format, which is a binary file format designed for storing a genome consists of multiple chromosomal sequences.
- To create a 2bi genome, you can follow the instruction from UCSC
|
Dash-bio, powered by plotly, python


