Effects of black soldier fly (Hermetia illucens) larvae meal protein as a fishmeal replacement on the growth and immune index of yellow catfish (Pelteobagrus fulvidraco)
An experiment of self-regeneration in synthetic cell which could sustain synthetic activities over a day by regenerating the important building blocks(protein components).

 © Aquarium Glaser GmbH
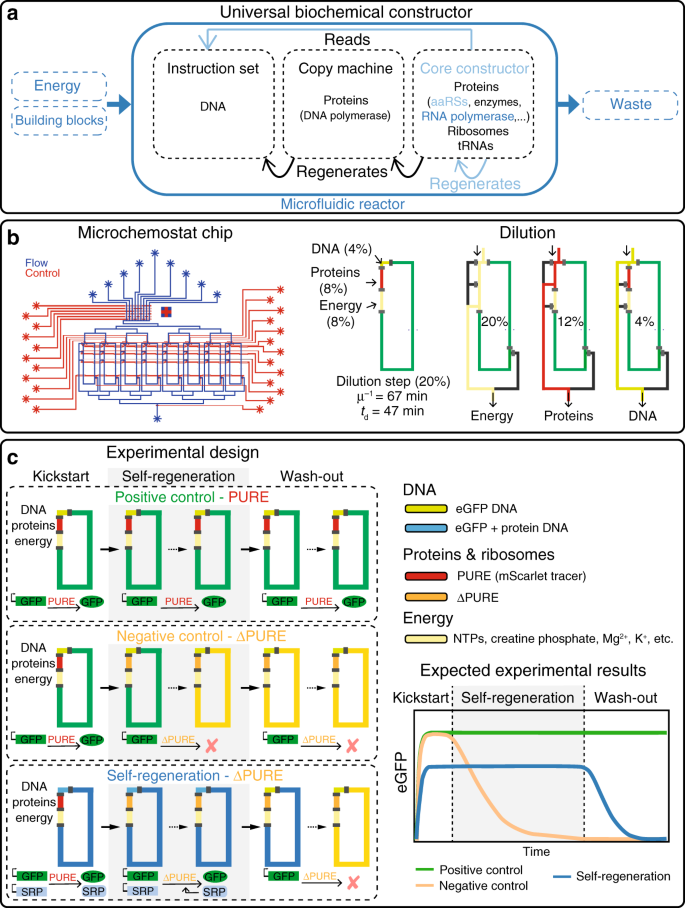 © nature.com
 © Karobben