用 ggplot 畫 hclust 的結果

用 ggplot 畫 hclust 的結果

用 ggplot 畫 hclust 的結果

drawing hclust result with ggplot

data(mtcars)

Tree <- hclust(dist(mtcars))
plot(Tree)

UOWJA0.png

library(ggplot2)
library(ggdendro)

hc <- hclust(dist(mtcars)) # heirarchal clustering
dendr <- dendro_data(hc, type="rectangle") # convert for ggplot
clust <- cutree(hc,k=5) # find 2 clusters
clust.df <- data.frame(label=names(clust), cluster=factor(clust))
## dendr[["labels"]] has the labels, merge with clust.df based on label column
dendr[["labels"]] <- merge(dendr[["labels"]],clust.df, by="label")
## plot the dendrogram; note use of color=cluster in geom_text(...)
ggplot() +
geom_segment(data=segment(dendr), aes(x=x, y=y, xend=xend, yend=yend)) +
geom_text(data=label(dendr), aes(x, y, label=label, hjust=0, color=cluster),
size=3) +
coord_flip() + scale_y_reverse(expand=c(0.2, 0)) +
theme(axis.line.y=element_blank(),
axis.ticks.y=element_blank(),
axis.text.y=element_blank(),
axis.title.y=element_blank(),
panel.background=element_rect(fill="white"),
panel.grid=element_blank())

美美噠!
UOWQXj.png

自定義間距:

library(ggplot2)
library(ggdendro)

hc <- hclust(dist(head(mtcars)))
dendr <- dendro_data(hc, type="rectangle") # convert for ggplot
clust <- cutree(hc,k=2) # find 2 clusters
clust.df <- data.frame(label=names(clust), cluster=factor(clust))
## dendr[["labels"]] has the labels, merge with clust.df based on label column
dendr[["labels"]] <- merge(dendr[["labels"]],clust.df, by="label")
## plot the dendrogram; note use of color=cluster in geom_text(...)
ggplot() +
geom_segment(data=segment(dendr), aes(x=x, y=y, xend=xend, yend=yend)) +
geom_text(data=label(dendr), aes(x, y, label=label, hjust=0, color=cluster),
size=3) +
coord_flip() + scale_y_reverse(expand=c(0.2, 0)) +
theme(axis.line.y=element_blank(),
axis.ticks.y=element_blank(),
axis.text.y=element_blank(),
axis.title.y=element_blank(),
panel.background=element_rect(fill="white"),
panel.grid=element_blank())

觀察數據可知, 樹圖數據在dendr$segment裏面, 名字在dendr$label裏面。先給定一個listWidth_tree = c(1,2,5,10,11,20)

hc       <- hclust(dist(head(mtcars)))

dendr <- dendro_data(hc, type="rectangle") # convert for ggplot
clust <- cutree(hc,k=2) # find 2 clusters
clust.df <- data.frame(label=names(clust), cluster=factor(clust))
## dendr[["labels"]] has the labels, merge with clust.df based on label column
dendr[["labels"]] <- merge(dendr[["labels"]],clust.df, by="label")
## plot the dendrogram; note use of color=cluster in geom_text(...)
ggplot() +
geom_segment(data=segment(dendr), aes(x=x, y=y, xend=xend, yend=yend)) +
geom_text(data=label(dendr), aes(x, y, label=label, hjust=0, color=cluster),
size=3) +
scale_y_reverse(expand=c(0.2, 0)) +
theme(axis.line.y=element_blank(),
axis.ticks.y=element_blank(),
axis.text.y=element_blank(),
axis.title.y=element_blank(),
panel.background=element_rect(fill="white"),
panel.grid=element_blank())

Width_tree = c(1,2,5,10,11,20)

dendr$labels$x = Width_tree[dendr$labels$x]
dendr$segments = dendr$segments[order(dendr$segments$x),]

## 做個list
List = c()
for(i in c(1:length(Width_tree))){
List = c(List, which(dendr$segments$x==i))
}

打包一個函數,方便重複畫圖

PLOT <- function(dendr){
ggplot() +
geom_segment(data=segment(dendr), aes(x=x, y=y, xend=xend, yend=yend)) +
geom_text(data=label(dendr), aes(x, y, label=label, hjust=0, color=cluster),
size=3) +
scale_y_reverse(expand=c(0.2, 0)) +
theme(axis.line.y=element_blank(),
axis.ticks.y=element_blank(),
axis.text.y=element_blank(),
axis.title.y=element_blank(),
panel.background=element_rect(fill="white"),
panel.grid=element_blank())
}
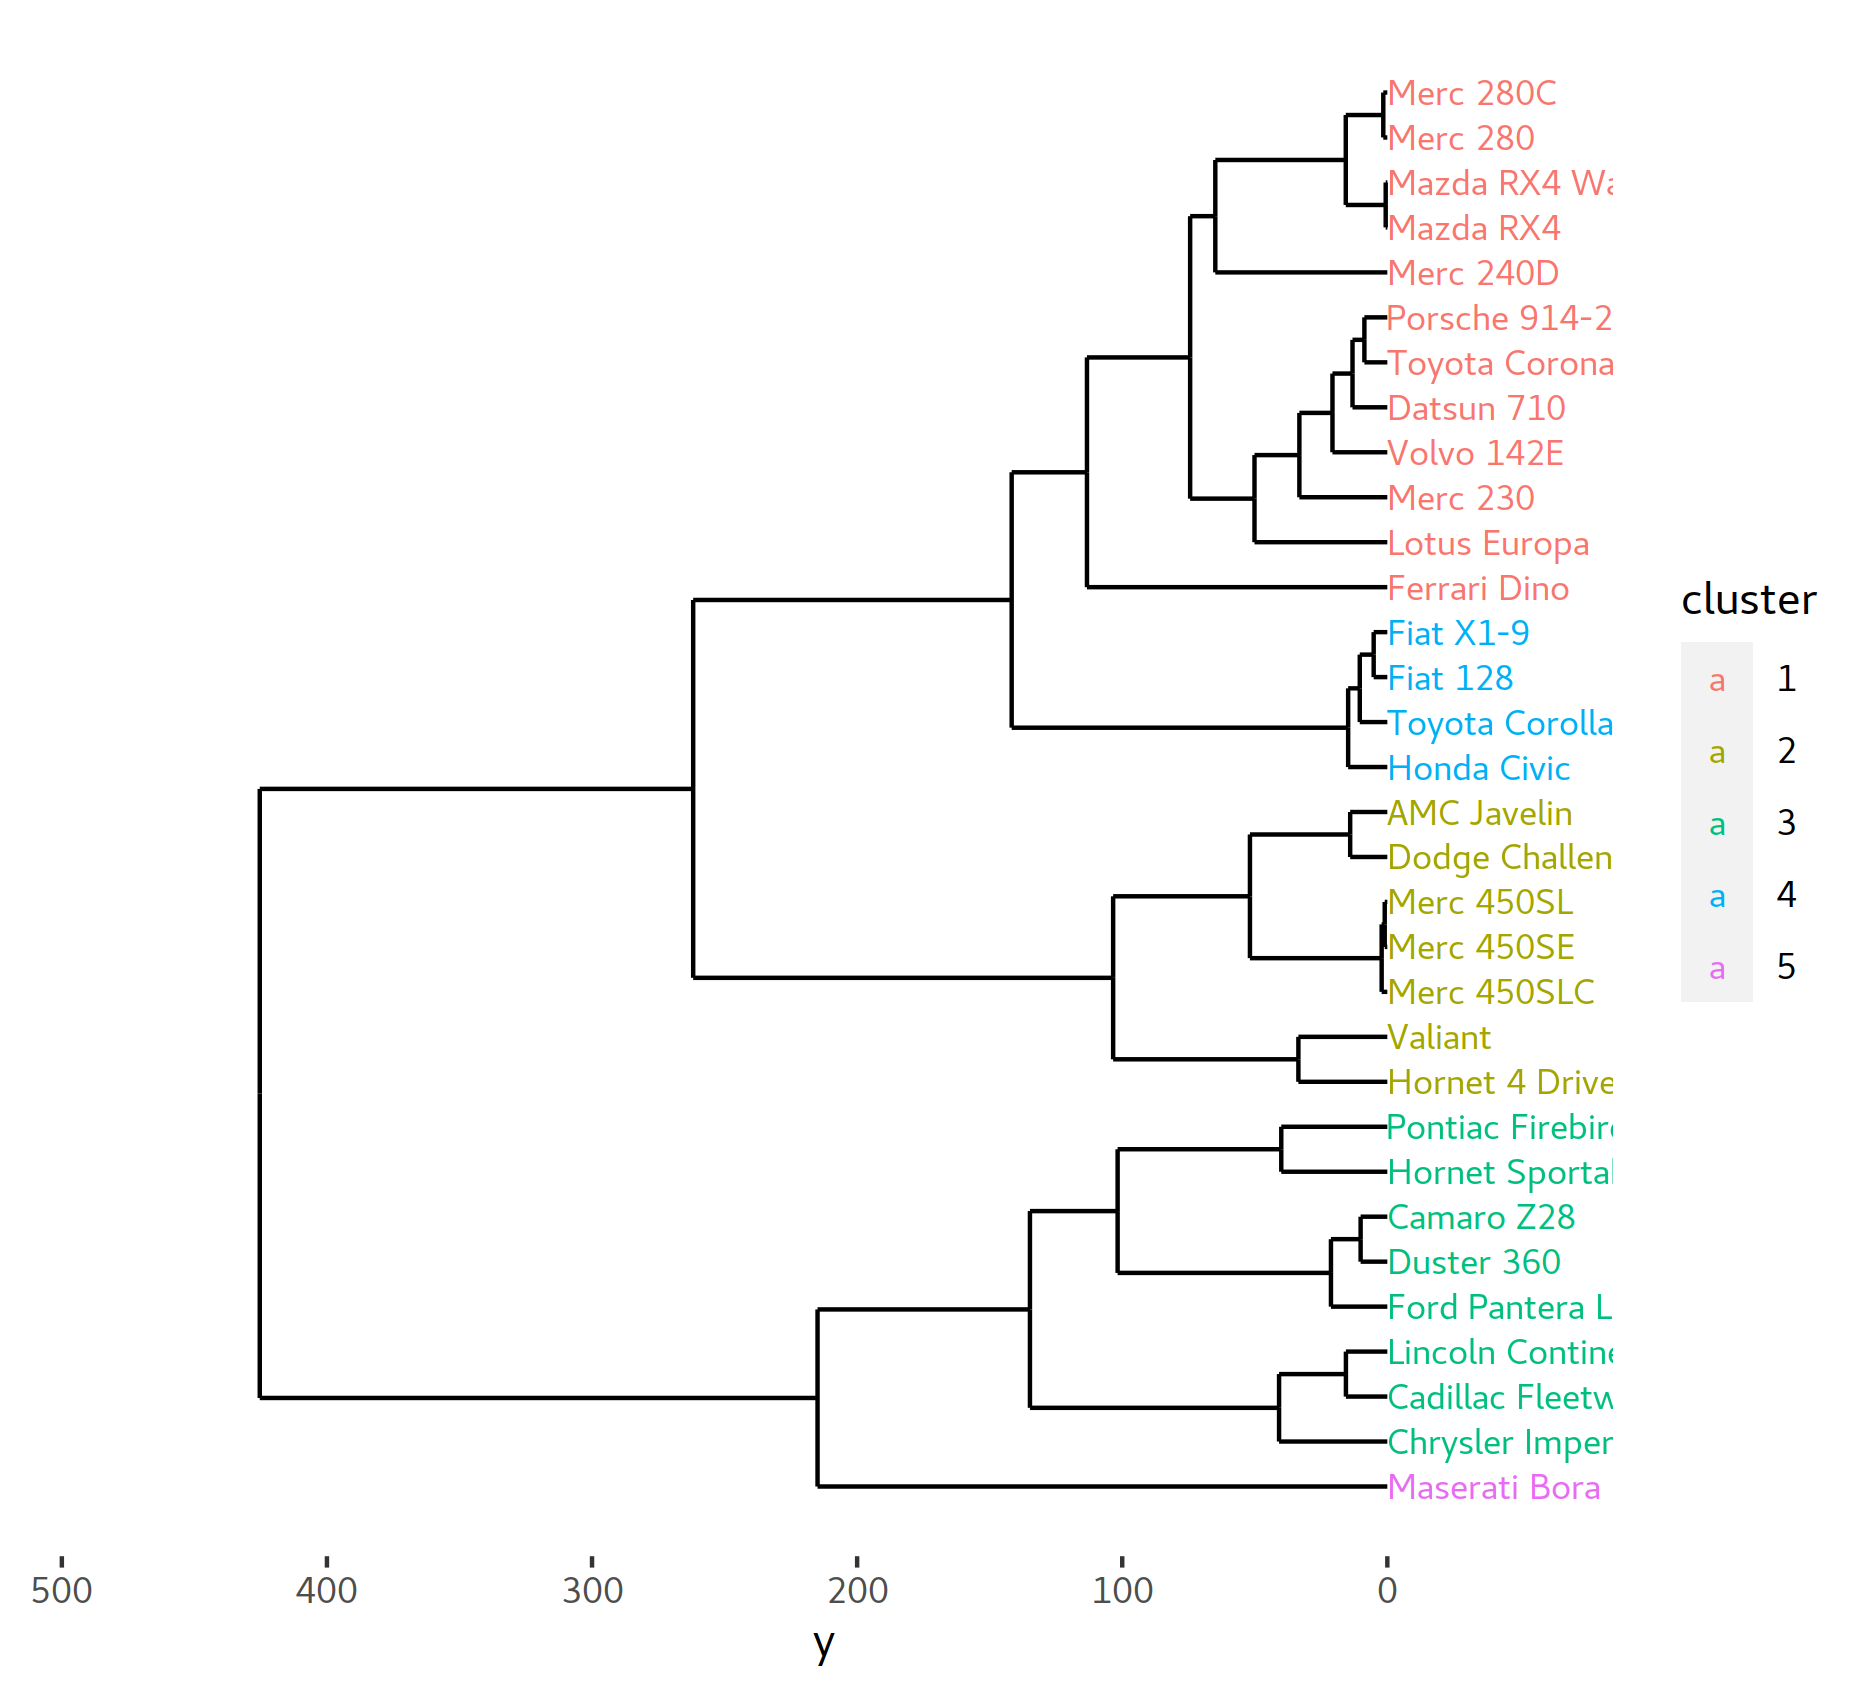
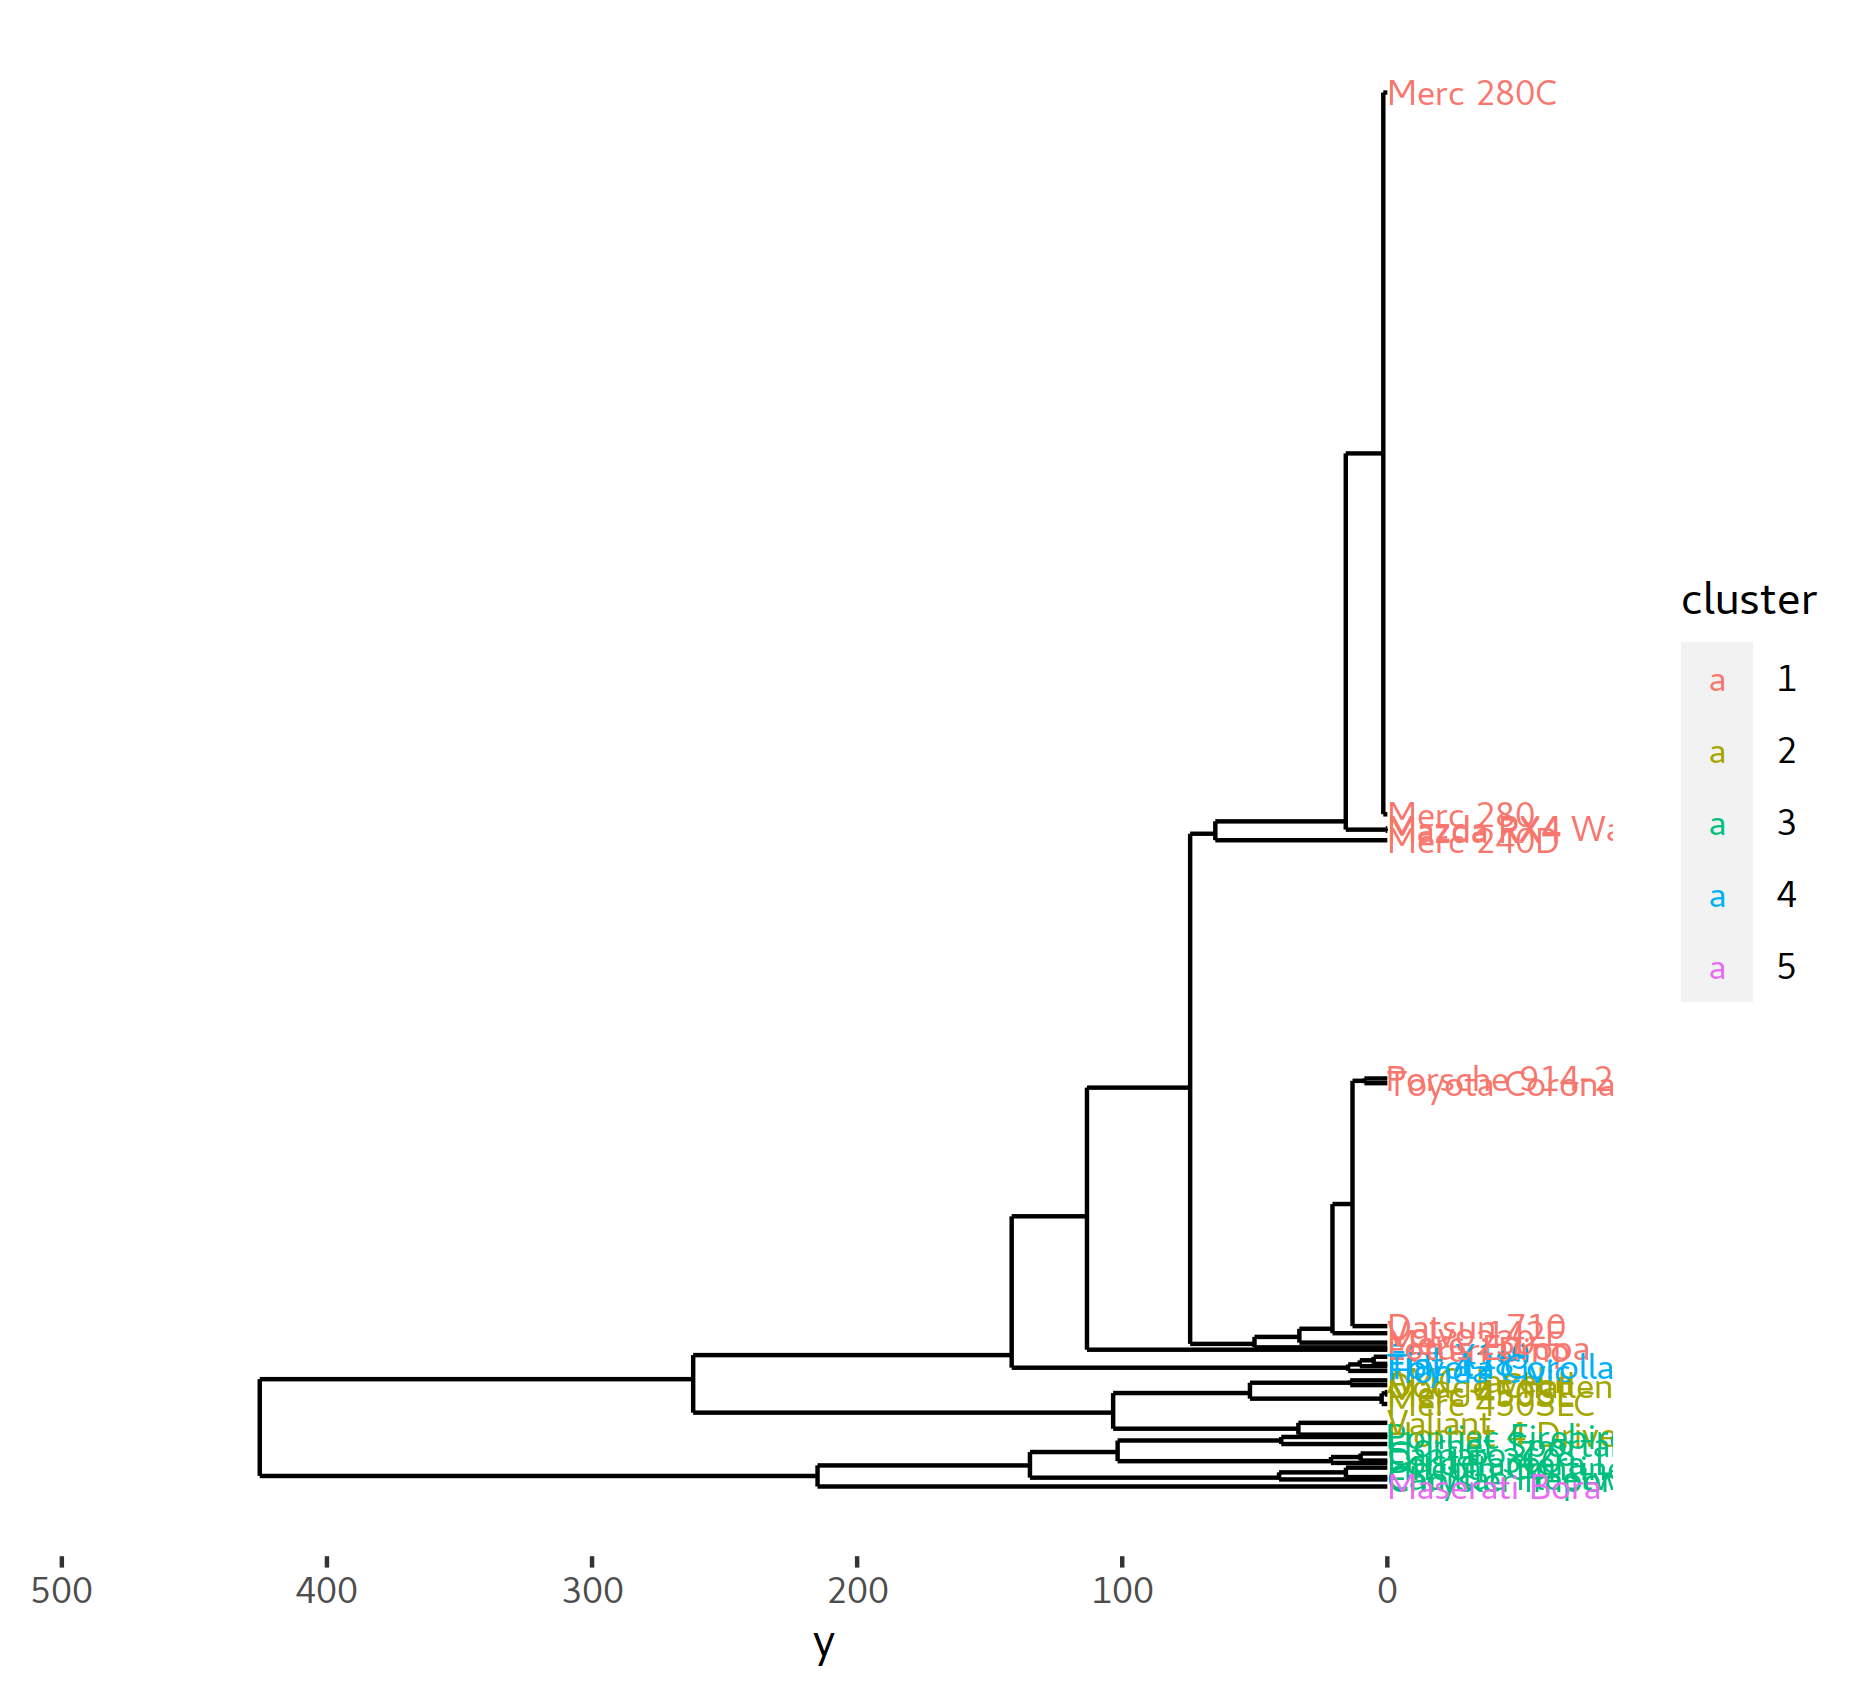
PLOT2 <- function(dendr){
ggplot() +
geom_segment(data=segment(dendr), aes(x=x, y=y, xend=xend, yend=yend)) +
geom_text(data=label(dendr), aes(x, y, label=label, hjust=0, color=cluster),
size=3) +
coord_flip() + scale_y_reverse(expand=c(0.2, 0)) +
theme(axis.line.y=element_blank(),
axis.ticks.y=element_blank(),
axis.text.y=element_blank(),
axis.title.y=element_blank(),
panel.background=element_rect(fill="white"),
panel.grid=element_blank())
}

調整豎線

for( i in c(1:6)){
Dif_tmp = Width_tree[i]- dendr$segments$x[List[i]]

dendr$segments$x[List[i]:nrow(dendr$segments)] = dendr$segments$x[List[i]:nrow(dendr$segments)]+Dif_tmp
dendr$segments$xend[List[i]:nrow(dendr$segments)] = dendr$segments$xend[List[i]:nrow(dendr$segments)]+Dif_tmp
}

PLOT(dendr)

UOWK1g.png

鏈接橫線

##刪除橫線
dendr$segments = dendr$segments[dendr$segments$x == dendr$segments$xend,]

Y_list = dendr$segments$y[duplicated(dendr$segments$y)]

for(i in Y_list){
tmp = (dendr$segments$x[dendr$segments$y == i])
dendr$segments = rbind(dendr$segments, data.frame(x=tmp[1],y=i,xend=tmp[2],yend=i))
}

PLOT(dendr)

能用。。。但是好像會有bug。。唉= =
UOW3Bn.png

修正

LS_judg<- function(TB){
if (TB['x'] == TB['xend']){
R = 'v'
}else{
R = 'h'
}
return(R)
}

##修正竖线
Seg = dendr$segments

for( i in c(nrow(dendr$segments):1)){
if(LS_judg(dendr$segments[i,]) == 'h'){
tmpy = dendr$segments[i,]$y
tmpTB = Seg[Seg$yend== tmpy,]
for( ii in c(1:nrow(tmpTB))){
if(LS_judg(tmpTB[ii,]) == 'v'){
Num = rownames(tmpTB[1,])
dendr$segments[match(Num, row.names(dendr$segments)),][c(1,3)] = sum(Seg[i,c('x','xend')])/2
}
}
}
}

## 重画横线:
dendr$segments = dendr$segments[dendr$segments$x == dendr$segments$xend,]

Y_list = dendr$segments$y[duplicated(dendr$segments$y)]

for(i in Y_list){
tmp = (dendr$segments$x[dendr$segments$y == i])
dendr$segments = rbind(dendr$segments, data.frame(x=tmp[1],y=i,xend=tmp[2],yend=i))
}

PLOT(dendr)

整合一下:

Width_tree = c(1,2,5,10,11,20)

LS_judg<- function(TB){
if (TB['x'] == TB['xend']){
R = 'v'
}else{
R = 'h'
}
return(R)
}

TreePlot <- function(dendr, Width_tree){
dendr$labels$x = Width_tree[dendr$labels$x]
dendr$segments = dendr$segments[order(dendr$segments$x),]
# 做個list
List = c()
for(i in c(1:length(Width_tree))){
List = c(List, which(dendr$segments$x==i))
}
# 調整豎線
for( i in c(1:length(dendr$labels$label))){
Dif_tmp = Width_tree[i]- dendr$segments$x[List[i]]
dendr$segments$x[List[i]:nrow(dendr$segments)] = dendr$segments$x[List[i]:nrow(dendr$segments)]+Dif_tmp
dendr$segments$xend[List[i]:nrow(dendr$segments)] = dendr$segments$xend[List[i]:nrow(dendr$segments)]+Dif_tmp
}
# 刪除添加新的橫線
dendr$segments = dendr$segments[dendr$segments$x == dendr$segments$xend,]
Y_list = dendr$segments$y[duplicated(dendr$segments$y)]
for(i in Y_list){
tmp = (dendr$segments$x[dendr$segments$y == i])
dendr$segments = rbind(dendr$segments, data.frame(x=tmp[1],y=i,xend=tmp[2],yend=i))
}
Seg = dendr$segments
for( i in c(nrow(dendr$segments):1)){
if(LS_judg(dendr$segments[i,]) == 'h'){
tmpy = dendr$segments[i,]$y
tmpTB = Seg[Seg$yend== tmpy,]
for( ii in c(1:nrow(tmpTB))){
if(LS_judg(tmpTB[ii,]) == 'v'){
Num = rownames(tmpTB[1,])
dendr$segments[match(Num, row.names(dendr$segments)),][c(1,3)] = sum(Seg[i,c('x','xend')])/2
}
}
}
}
# 重画横线:
dendr$segments = dendr$segments[dendr$segments$x == dendr$segments$xend,]
Y_list = dendr$segments$y[duplicated(dendr$segments$y)]
for(i in Y_list){
tmp = (dendr$segments$x[dendr$segments$y == i])
dendr$segments = rbind(dendr$segments, data.frame(x=tmp[1],y=i,xend=tmp[2],yend=i))
}
return(dendr)
}
UOWYNV.png UOWK1g.png UOW3Bn.png UOW1ns.png

再來試一下:

  1. 正常情況:
library(ggplot2)
library(ggdendro)

hc <- hclust(dist(mtcars)) # heirarchal clustering
dendr <- dendro_data(hc, type="rectangle") # convert for ggplot
clust <- cutree(hc,k=5) # find 2 clusters
clust.df <- data.frame(label=names(clust), cluster=factor(clust))
## dendr[["labels"]] has the labels, merge with clust.df based on label column
dendr[["labels"]] <- merge(dendr[["labels"]],clust.df, by="label")
## plot the dendrogram; note use of color=cluster in geom_text(...)
PLOT2(dendr)

轉化後:

Width_tree =c(2, 5, 6, 10, 12, 13, 16, 20, 23, 24, 29, 37, 41, 42, 45, 47, 51, 53, 54, 57, 60, 61, 63, 67, 70, 173, 175, 276, 280, 281, 287, 593)

AA <- TreePlot(dendr,Width_tree)
PLOT2(AA)
原圖 後圖
UOh9Ld.png UOWMcQ.png

终于- - 终于终于, 修正好了, 最终版本
UOWMcQ.png

else: factoextra+dendextend

Author

Karobben

Posted on

2020-08-04

Updated on

2023-06-06

Licensed under

Comments