Understanding the geom_point Function in ggplot2© Karobben

Understanding the geom_point Function in ggplot2

Introduction

Data visualization is an essential aspect of data analysis, allowing us to understand patterns, trends, and relationships in our data. In R, one of the most popular packages for data visualization is ggplot2. Among its many functions, geom_point stands out as a fundamental tool for creating scatter plots. In this blog post, we’ll delve deep into the geom_point function, exploring its basic grammar and how to customize the appearance of points in your plots.

Basic Grammar and Code Example

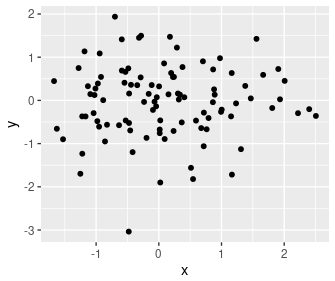
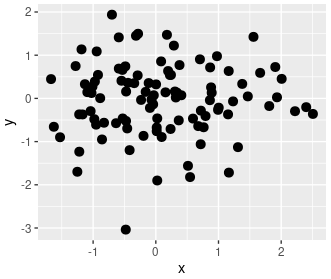
The basic grammar of geom_point is straightforward. At its core, you need a dataset and aesthetic mappings. The x and y aesthetics are the most common mappings used with geom_point.

Here’s a simple example:

library(ggplot2)

# Sample data
data <- data.frame(
x = rnorm(100),
y = rnorm(100)
)

# Basic scatter plot
ggplot(data, aes(x=x, y=y)) +
geom_point()
geom_point

This code will produce a scatter plot with the x and y values from our sample data.

Customizing Point Appearance

  1. Changing Point Color

You can change the color of the points using the color argument inside the aes() function:

ggplot(data, aes(x=x, y=y, color="white")) + 
geom_point()
geom_point assign a group by color

If you want to color points based on a variable, you can do so by mapping that variable to the color aesthetic:

data$group <- sample(c("A", "B"), 100, replace = TRUE)

ggplot(data, aes(x=x, y=y, color=group)) +
geom_point() + theme_bw()
geom_point color by group

Show the name of group on the center of scatter points

data_group <- aggregate(cbind(x, y) ~ group, data=data, FUN=median)
ggplot(data, aes(x=x, y=y, color=group)) +
geom_point() + theme_bw() + geom_label(data = data_group, aes( label = group))
geom_point label

Changing Point Size

To change the size of the points, use the size argument:

ggplot(data, aes(x=x, y=y)) + 
geom_point(size=3)
geom_point point size

Changing Point Shape

ggplot2 provides various shapes for points. You can change the shape using the shape argument:

ggplot(data, aes(x=x, y=y)) + 
geom_point(shape=17)
geom_point point shapes

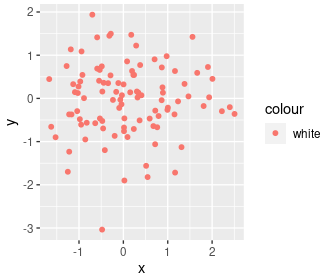
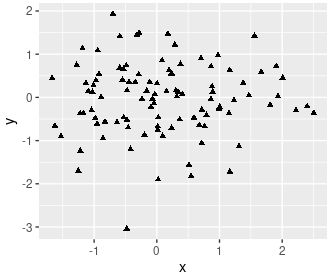
Shapes are represented by numbers. For example, 16 is a solid circle, 17 is a triangle, and so on. You can explore the ?points documentation in R to see a list of available shapes.

Conclusion

The geom_point function in ggplot2 offers a flexible and powerful way to create scatter plots in R. With just a few lines of code, you can produce a basic plot, and with a few more tweaks, you can customize it to your liking. As you continue your data visualization journey, remember that the key is not just to make plots look good, but to make them convey the right information effectively.

Understanding the geom_point Function in ggplot2

https://karobben.github.io/2023/10/04/R/geom-point/

Author

Karobben

Posted on

2023-10-04

Updated on

2023-10-04

Licensed under

Comments