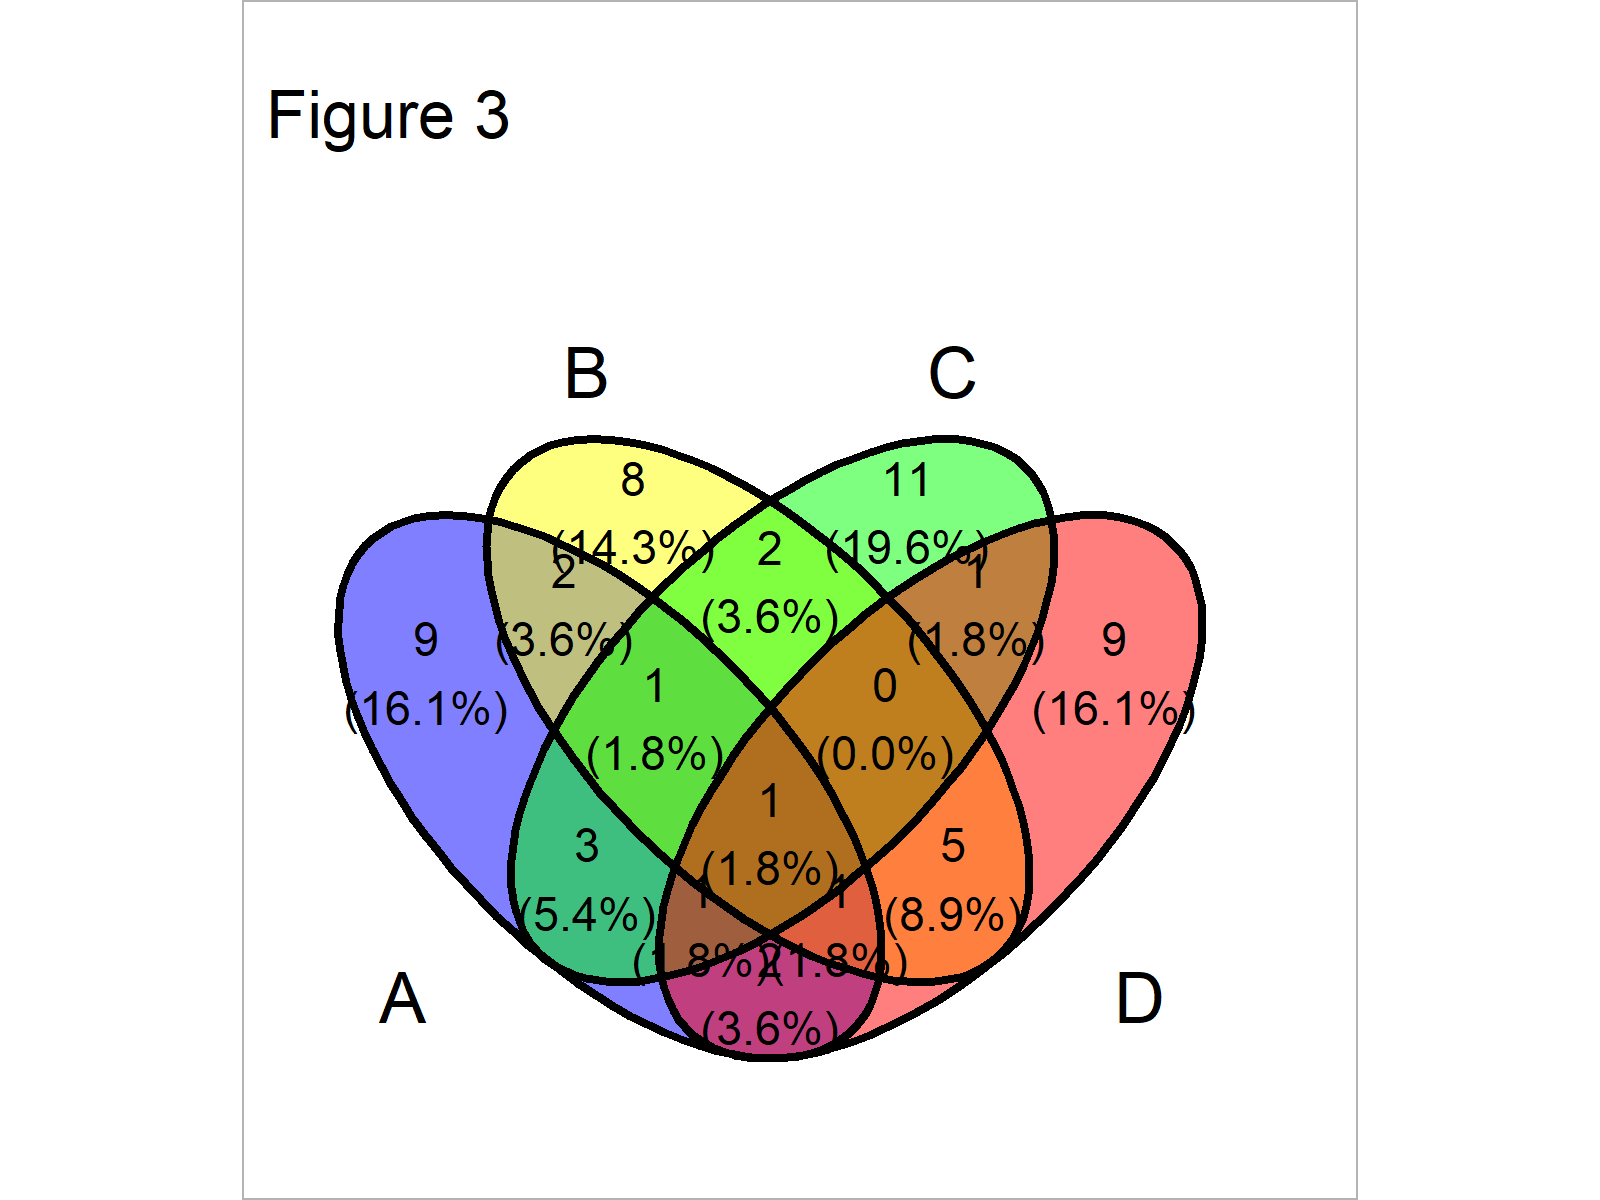
Venn Plot in R
Venn plot is a visualization tool to display overlapping or unique sets between two or more groups. In R, the 'VennDiagram' package provides an easy-to-use interface to create Venn plots with customizable colors, labels, and shapes. Who sad this?
Read more


