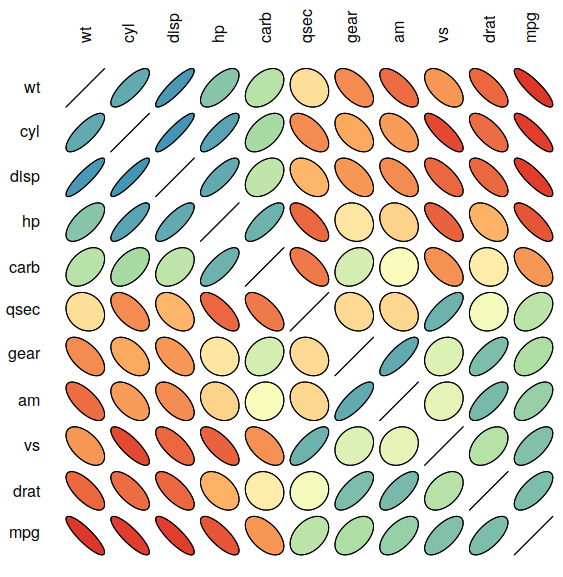
PCA and PCoA
wordcloud© Karobben

wordcloud

Wordcloud is a data visualization technique used to represent text data in a graphical format. In Python, the wordcloud library is used to generate wordclouds. It takes a text file or a string of text as input, and generates an image where the size of each word is proportional to its frequency in the input text. Who said this?
Read more
R 语言报错集
Ploty

Ploty

heatmap is fun!
Read more
GGmap: geom_polygon | ggplot examples
nCov(新冠状病毒数据获取与可视化)
Pheatmap

Pheatmap

pheatmap is an R package for creating heatmaps to visualize large and complex data sets. It provides advanced features such as clustering and annotation, and allows customization of color schemes, row and column labels, and more. The resulting heatmaps can be used to identify patterns and relationships in the data. Who said this?
Read more
geom_step | ggplot examples
GGcal | ggplot for Calendar
geom_bin2d | ggplot example2
geom_quantile
ggalluvial (Picture needed)
R-gganimate | ggplot examples
geom_curve | ggplot
geom_hex | ggplot examples