0 Posted 2020-09-13Updated 2024-01-11R / Bio / Abi11 minutes read (About 1699 words)Machine Learning in Action: ab1 fileow to heck the ab1 data with R or PythonRead more
0 Posted 2020-09-03Updated 2024-01-11R / others4 minutes read (About 660 words)用R语言来指导实验我居然用R语言来指导点样顺序和位置Read more
0 Posted 2020-09-03Updated 2024-01-11R / Plot / others2 minutes read (About 256 words)Fonts family in R plotR: Stylize the font in your Chart with library showtextRead more
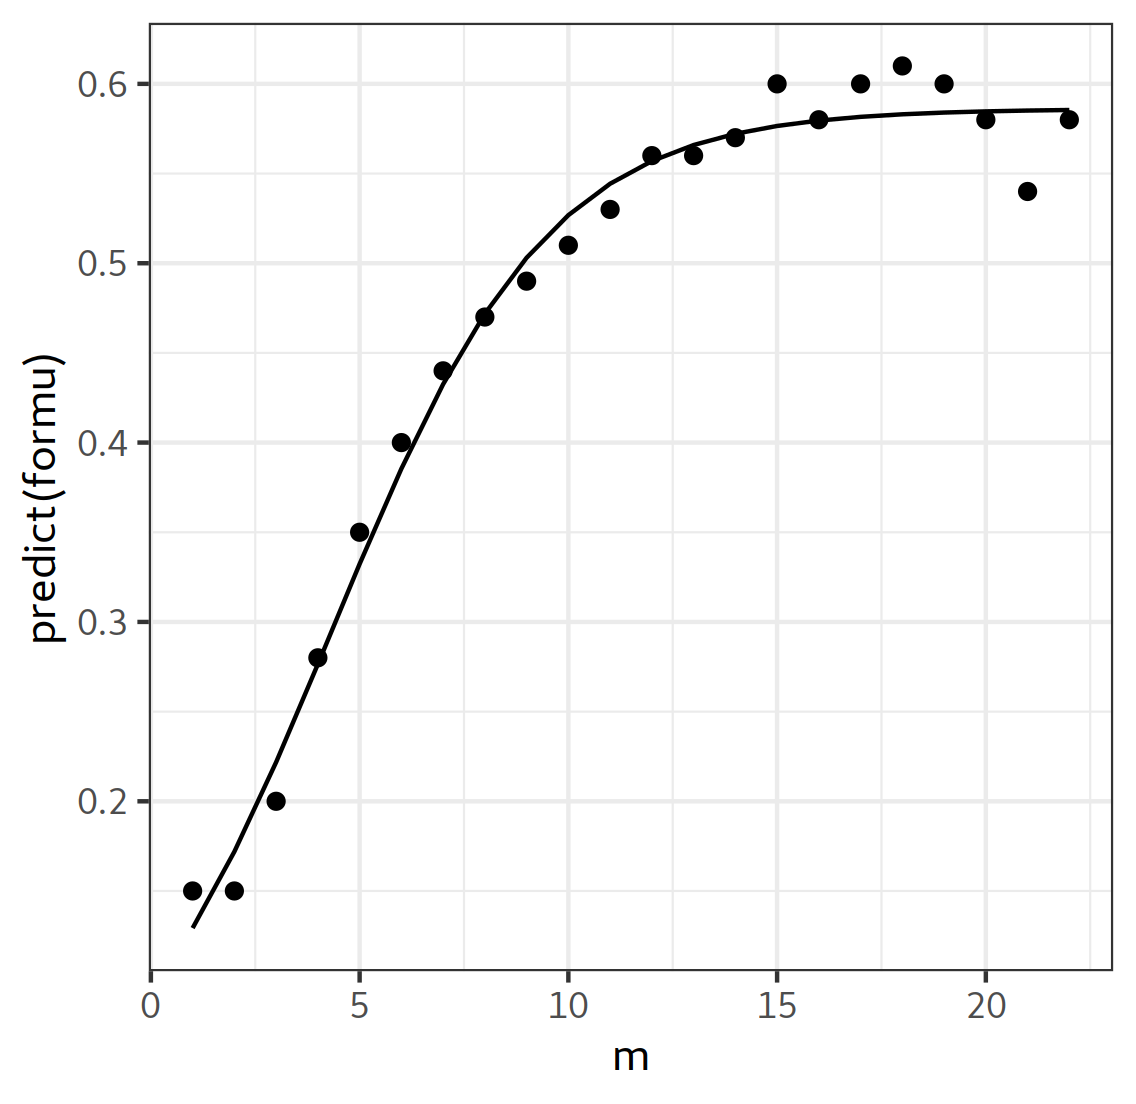
0 Posted 2020-08-21Updated 2024-01-11R / Data / Statistic / Regression5 minutes read (About 787 words)logistic regression in RCalculating logistic function with R| logistic regression| 逻辑斯蒂曲线Read more
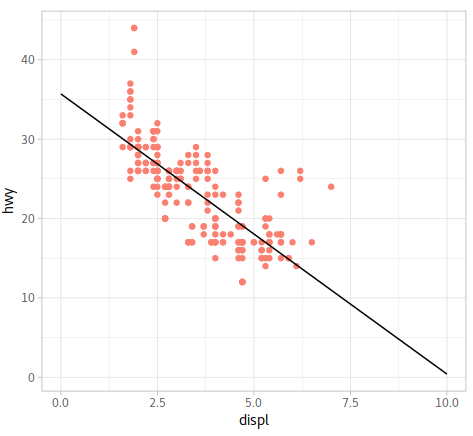
0 Posted 2020-08-21Updated 2024-01-11R / Data / Statistic / Regression18 minutes read (About 2695 words)Linear RegressionCalculating regression function by RRead more
0 Posted 2020-08-20Updated 2024-01-11R / Data / Machine Learninga minute read (About 195 words)Machine Learning (out of date)Some machine learning codes for RRead more
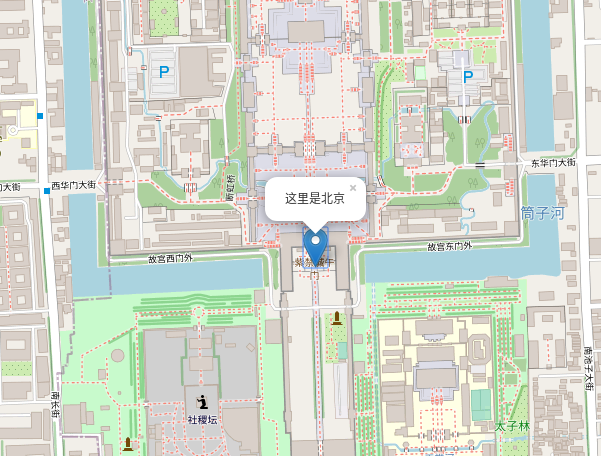
0 Posted 2020-08-15Updated 2024-01-11R / Plot / Maps2 minutes read (About 273 words)leaflet in RLeaflet is an Js library which support the R API. You can draw high complicate and interoperable maps with itRead more
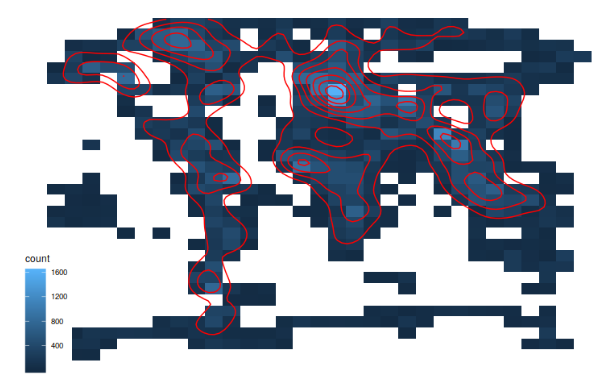
0 Posted 2020-08-13Updated 2024-01-11R / Plot / GGPLOTa minute read (About 120 words)Density plotPlot the density distribution of your data by ggplotRead more
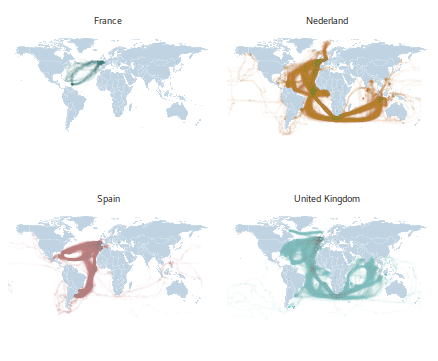
0 Posted 2020-08-13Updated 2024-01-11R / Plot / GGPLOT2 minutes read (About 280 words)GGmap: geom_map | ggplot for mapsmap function from ggplotRead more
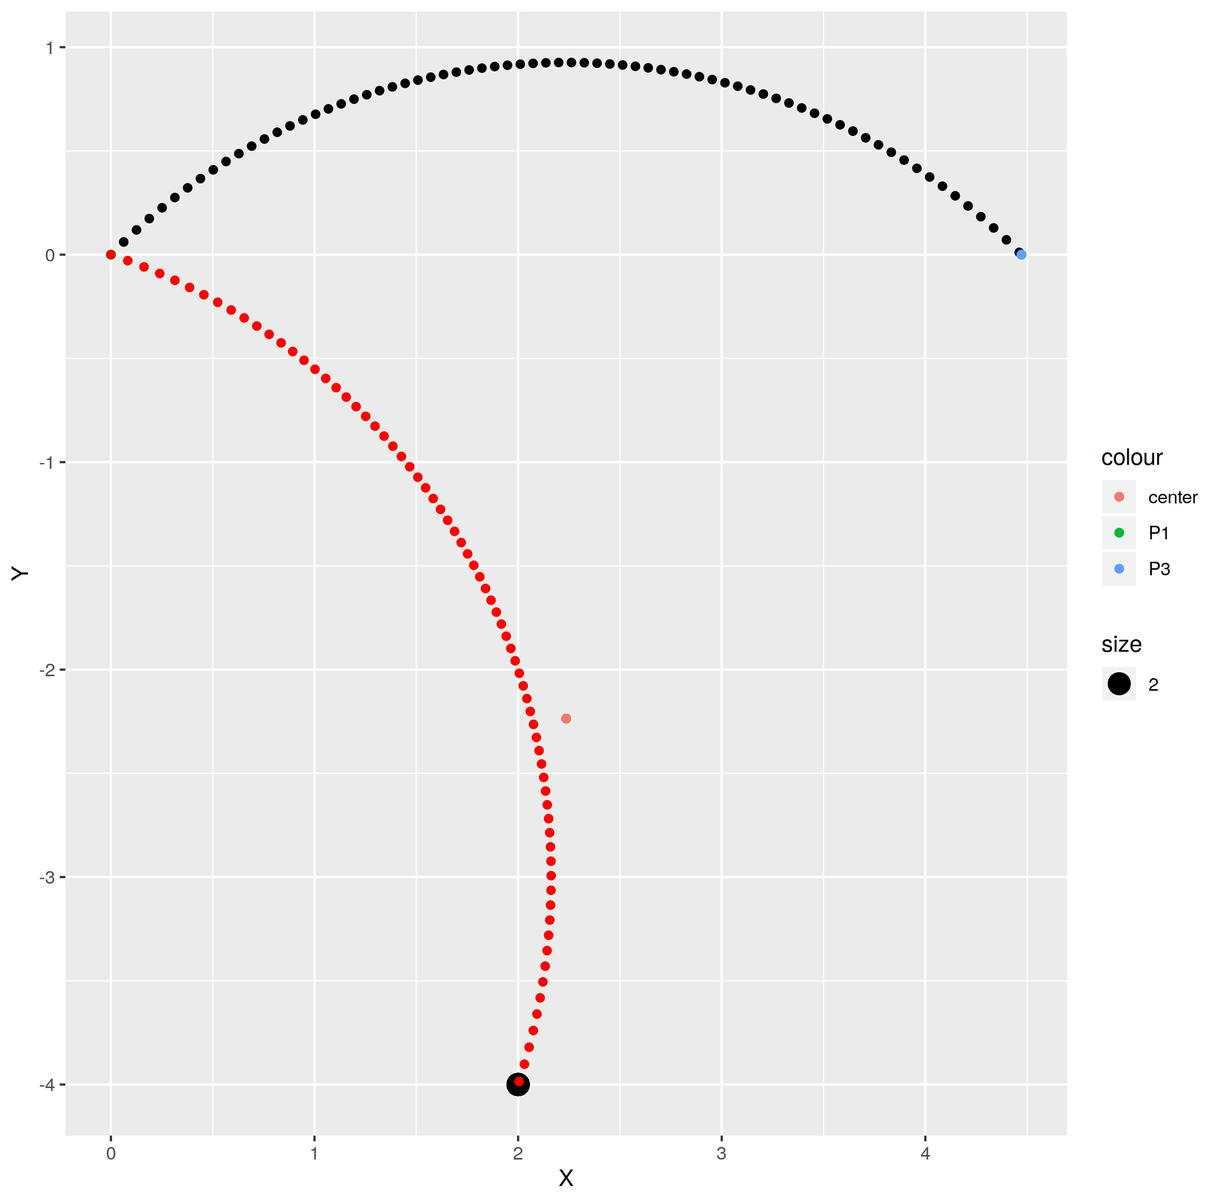
0 Posted 2020-08-13Updated 2024-01-11R / Plot / GGPLOT4 minutes read (About 632 words)GGplot 杂耍Some tricks for ggplot. Have funRead more
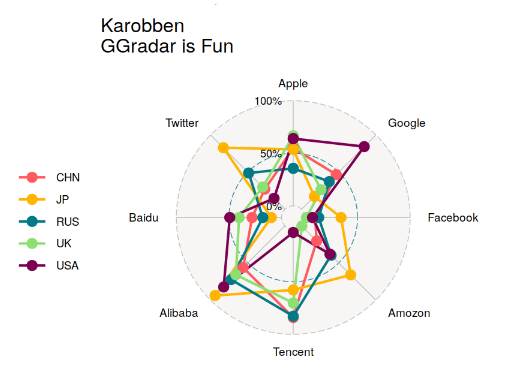
0 Posted 2020-08-13Updated 2024-01-11R / Plot / GGPLOTa minute read (About 213 words)GGradar | ggplot exampleRardar plot for ggplot. It's not the best resolution, but it works in ggplot!Read more
0 Posted 2020-08-13Updated 2025-09-02R / Plot / othersa few seconds read (About 37 words)Other Tutorials for ROther tutorials I collected on Internet. Updating...Read more
0 Posted 2020-08-13Updated 2024-01-11R / Plot / others9 minutes read (About 1277 words)NetWorkPlotThere are few libraries for draw the network Plot. JS library networkD3 is diffidently my favorite one!Read more
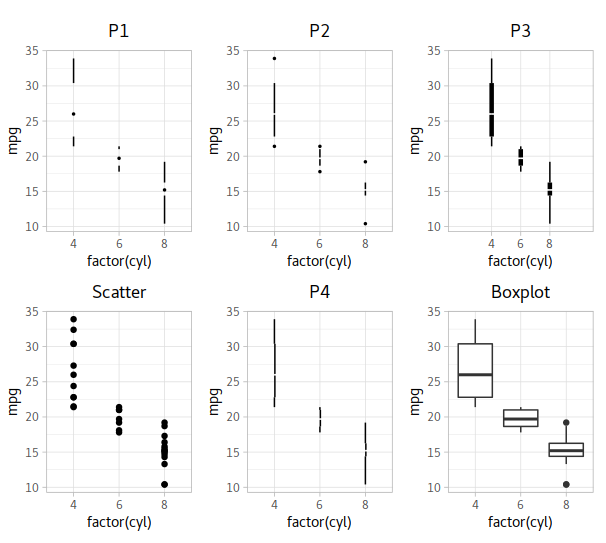
0 Posted 2020-08-13Updated 2024-01-11R / Plot / GGPLOTa minute read (About 173 words)geom_tufteboxplot | ggplot examples | Another boxplot R: ggplot, ggplot, tufteboxplot, stylized boxplotRead more
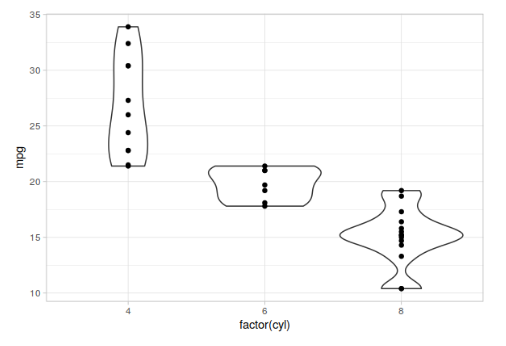
0 Posted 2020-08-13Updated 2024-01-11R / Plot / GGPLOTa few seconds read (About 58 words)geom_violin| ggplot examplesR: ggplot, ggplot, Violin plotRead more